Are you looking for a beginner’s guide to Google Analytics? How does Google Analytics work, anyway?
Google Analytics 4 (GA4) offers powerful insights about your website visitors. However, using it isn’t straightforward, and many beginners find it complex and difficult to learn.
Hi there 👋. My name is Jolissa, and I’ve been using Google Analytics since 2011 and writing Google Analytics tutorials since 2012! I’m the Senior Content Writer here at MonsterInsights, and I’m here to help you learn what Google Analytics can do for your business or brand.
So, in this beginner’s guide to Google Analytics, I’ll break down the basics of how Google Analytics works. I’ll also help you navigate to different reports and explain what they mean.
By the time I’m done, Google Analytics 4 will no longer feel like a complicated mystery to you!
In This Article:
Google Analytics 4 Tutorial Video
What is Google Analytics?
In simple words, Google Analytics is a free tool provided by Google that tracks and reports website traffic and user behavior.
It collects data on metrics like page views, sessions, and user demographics, enabling businesses to analyze performance, optimize content, and improve marketing strategies.
For instance, let’s say you own an eCommerce store and want to know how many users visit your website.
With the help of Google Analytics, you can see the number of visitors to your store, how much they spend, where they’re coming from, which device they’re using, and much more.
How Google Analytics Works
Google Analytics works by implementing a small piece of JavaScript code on your website that collects visitor data. Here’s a simplified breakdown of how it functions:
- Tracking Code Installation: When you set up Google Analytics, you add a JavaScript tracking code to your website. This code is what collects data about your visitors.
- Cookie Placement: When a user visits your website, Google Analytics places cookies on their browser. These small files store information about the user’s activities.
- Data Collection: The tracking code records various user interactions like page views, time spent on each page, clicks, and conversions (key events).
- Data Processing: The collected data is sent to Google Analytics servers, where it’s processed and organized into meaningful metrics and dimensions.
- Report Generation: The processed data is then presented in various reports within your Google Analytics dashboard, giving you insights into your website’s performance.
What does Google Analytics do?
Google Analytics tracks and analyzes website traffic and user behavior.
It measures metrics like page views, session duration, and user demographics. Businesses use it to monitor performance, evaluate audience engagement, and optimize their marketing strategies.
Here are some of the benefits of using Google Analytics:
- Measure your website’s performance
- See if your marketing efforts are working
- Get inspiration for which type of content to create or products to sell on your website
- Divide users into different segments (like age, gender, country, device, etc.) to see which ones are more engaged
- Figure out which website pages you should optimize in order to boost conversions
Convinced you should be using Google Analytics? Read on to find out how to set it up and use it to grow your business.
How to Use Google Analytics 4
Google Analytics is intimidating at first glance, but with this tutorial and some practice, you’ll be using it to read and understand your website’s data in no time.
Step 1: Create a Google Analytics Account and Add The Tracking Code
The first thing you’ll need to do is create a Google Analytics account and add a tracking code to your website.
If you need help with these two steps, you can follow our easy guides on setting up a Google Analytics account and how to add the tracking code to your WordPress website to get started.
If your website isn’t on WordPress, you’ll need to either look up the instructions for installing it on your CMS (like Squarespace or Wix), or copy and paste the tracking code into your website’s header file.
So, what is a tracking code?
Your Google Analytics tracking code is a snippet of code that allows Google Analytics to track the visitors on your website and the actions that they perform.
It’s made up of a programming language called JavaScript and looks something like this:

You don’t need to understand the contents of the code, but you might like to know how it all works.
When a user visits your website, Google Analytics will drop a cookie on the user’s browser. Cookies are small files that contain information about the user’s activities.
Using these cookies, Google Analytics will be able to see how the user behaves on your website and collect this information to show you in different reports.
Step 2: Set up Conversions (Key Events)
If you want Google Analytics to tell you how many of your visitors completed a conversion, like signing up for your newsletter, filling out a form, watching a video, viewing a certain page, or buying a product, you’ll have to set up conversions.
Google Analytics 4 can automatically track some events on its own with its Enhanced Measurement tracking, like file downloads, video views, form submissions, and a few more.
However, keep in mind that there are a few constraints with GA4’s built-in enhanced tracking.
For instance, video tracking only works with YouTube videos, form tracking has some reported issues if you’re also using a Facebook Pixel, and scroll tracking only fires if a user scrolls to the bottom of your pages.
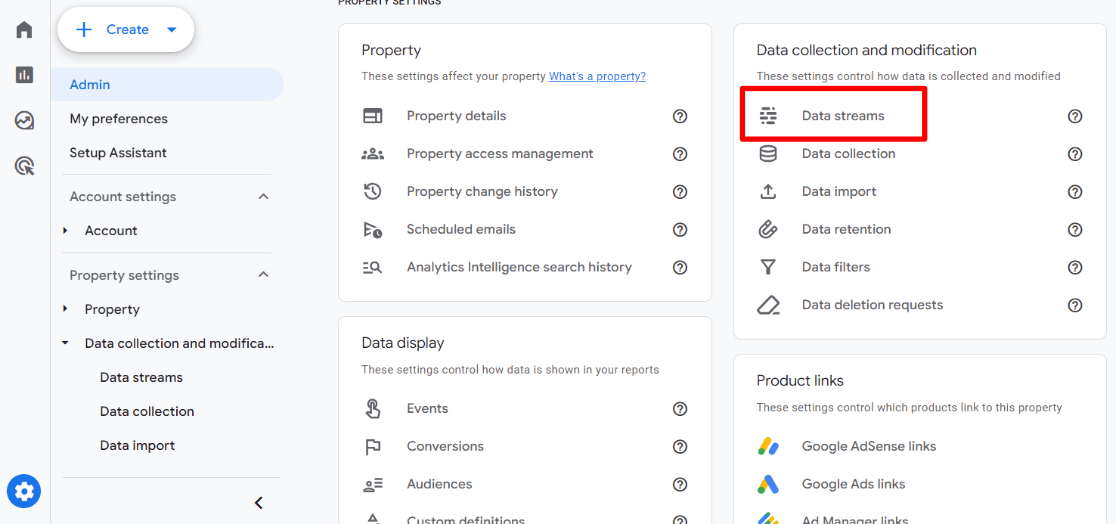
To set up enhanced measurement, head to the Admin cog, then Data Streams:
After that, click into your data stream:
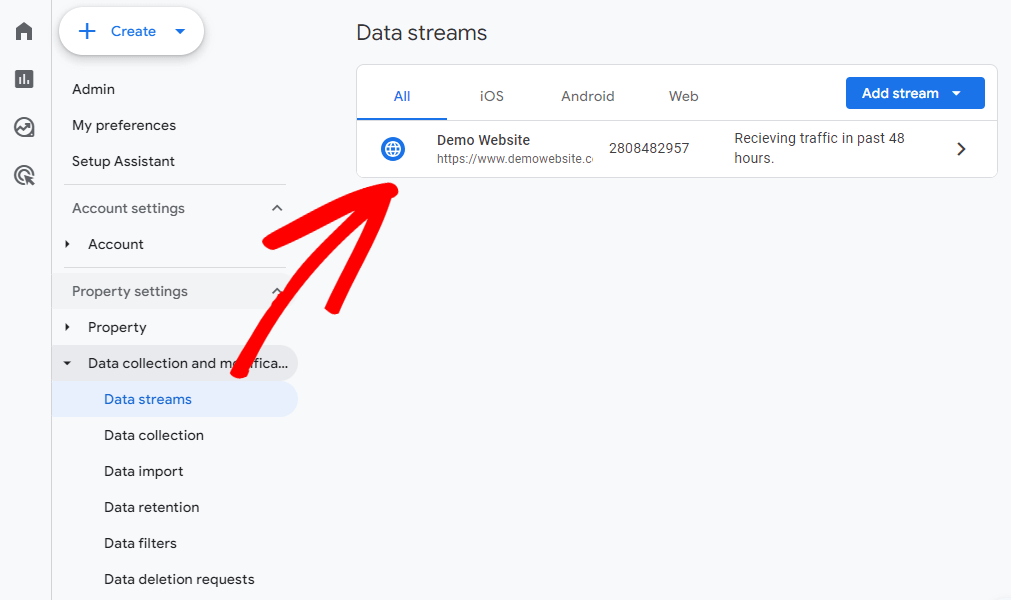
Now, you’ll see an Enhanced Measurement section.
If you want Google Analytics to attempt to track events on its own, make sure this is flipped on.

Once it’s switched on, you can click on the cog icon to choose what’s automatically tracked:

IMPORTANT NOTE: MonsterInsights users, please make sure your enhanced measurement is turned off (except for Site search if you’d like to automatically track site searches).
Now, you can mark whichever events you want tracked as conversions (key events).
So, when someone completes an event of your choice (downloading a file, submitting a form, etc.), it’ll count as a conversion in Google Analytics.
Note that conversions are called ‘key events’ in Google Analytics.
To do this, head to the Admin cog » Key events.
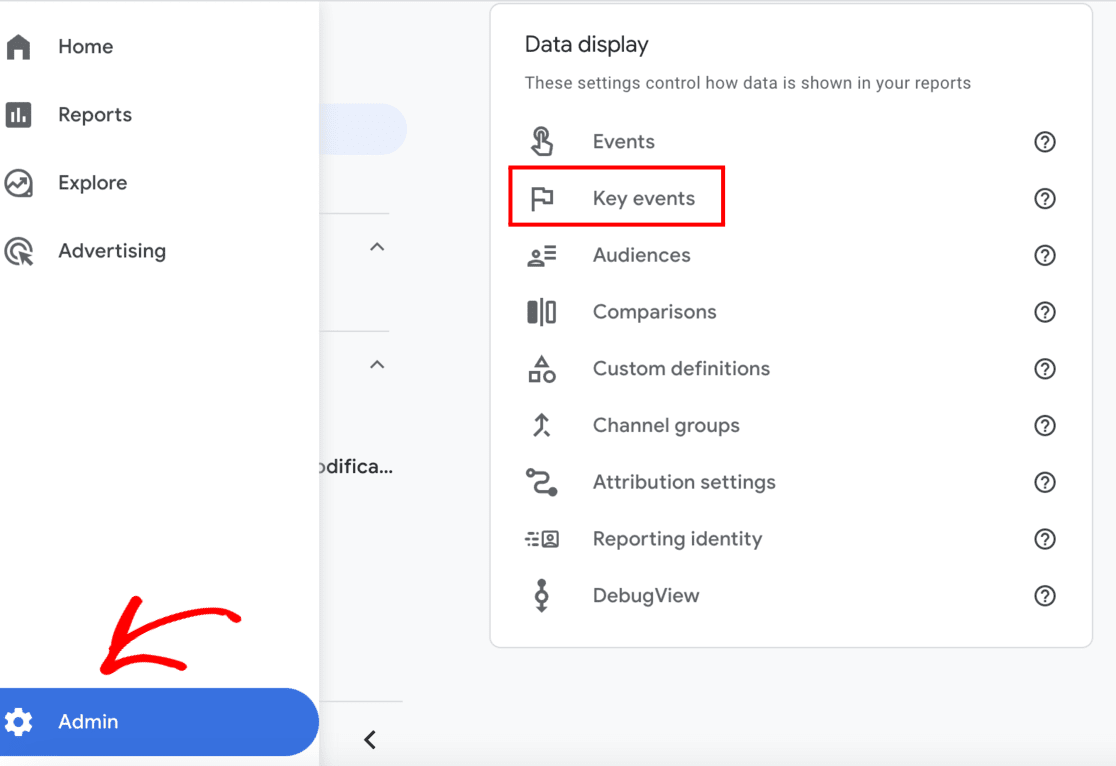
Then, you’ll be able to click the switch to mark an event as a conversion:

Looking to set up eCommerce tracking? That’s a bit more complicated, but you can check out how easy it is with MonsterInsights and WordPress.
Google Analytics Beginner’s Guide: Reports
Once you’ve created an account and added the tracking code, it’s time to see what can you do with Google Analytics.
As you start, you’ll arrive at Google Analytics home. It gives you a quick overview of how your website is performing.

For instance, you can see:
- Users: How many visitors came to your website (in the past 7 days or whatever date period you have selected)
- New users: Of the users who visited your site, how many of them hadn’t visited your website before
- Average engagement time: How much average time a visitor spends on the website
- Event count: How many events (clicks, form submissions, etc.) were completed
On the left-hand side panel, you’ll see a navigation sidebar that expands when you mouse over it:

To access your reports, head to the Reports tab.

You’ll see a new navigation with Google Analytics reports:
- Reports snapshot
- Realtime
- Acquisition
- Engagement
- Monetization
- Retention
- Demographics
- Tech
Let’s take a look at each of these reports, what they track, and how you can use them.
Realtime Report

The Realtime report shows the number of users on your website right now. This is where you go to see real-time activity on your website.
The main card overlaid on the world map shows how many users have visited your site in the last 30 minutes, plus what percentage of them were on desktop, mobile, or tablet-type devices.
When you scroll down the page, you’ll see cards with different real-time data to check out:

Realtime reports are great for measuring the performance of a recent campaign that you’re running, like a sale, free giveaway, or promoting content on social media.
Acquisition Report
The Acquisition report in Google Analytics breaks down your website traffic. If you want to figure out how you acquired your traffic, this is the report to find that data.
We recommend starting with the Traffic Acquisition report to see the channels your visitors used to find your website:

As you are getting started with Google Analytics, acquisition reports are extremely useful. They’ll tell you how your traffic reaches your website.
Google Analytics will divide your web traffic into traffic categories such as:
- Organic Search: Organic traffic is the traffic that comes from search engines like Google or Bing
- Direct: This is the traffic that arrives when someone types in your website’s URL, opens your website through a bookmark, or when Google cannot recognize the traffic source
- Referral: Referral traffic is the traffic that comes from links to your site elsewhere on the web
- Paid Search: If you’re running Google Ads, that traffic will show up here
- Organic Social: This is the non-ad traffic that arrives from social media platforms like Facebook or Twitter
If you want more detail, you can dig deep in the Acquisition report to find traffic sources.
For instance, to see more exact channels, click the Session default channel group dropdown:

From the dropdown, choose Session source/medium. Then, you’ll be able to see more detail about exactly which traffic sources sent traffic to your site.

With this information, you will know where to invest your time and money.
For instance, if you’re lacking organic traffic, you need to focus more on search engine optimization.
Engagement Report
When it comes to finding out what your visitors are doing while they’re on your website, you need to look at the Engagement report in Google Analytics.
This is where you can see events your visitors trigger, conversions they completed, and pages they visited.

In this section, the most helpful report for beginners is Pages and screens. It includes both events and conversions for each page. Let’s take a look.

In this report, you’ll see all your pages that were visited in the time period you have selected. For each page, you’ll see:
- Views
- Users
- Views per user
- Average engagement time
- Event count
- Key events (formerly called conversions)
- Total revenue
With all of this data, you can see which of your pages are getting the most views, how much time visitors are spending on them, and whether any conversions occurred on each page.
This gives you an overview of how each of your pages is performing.
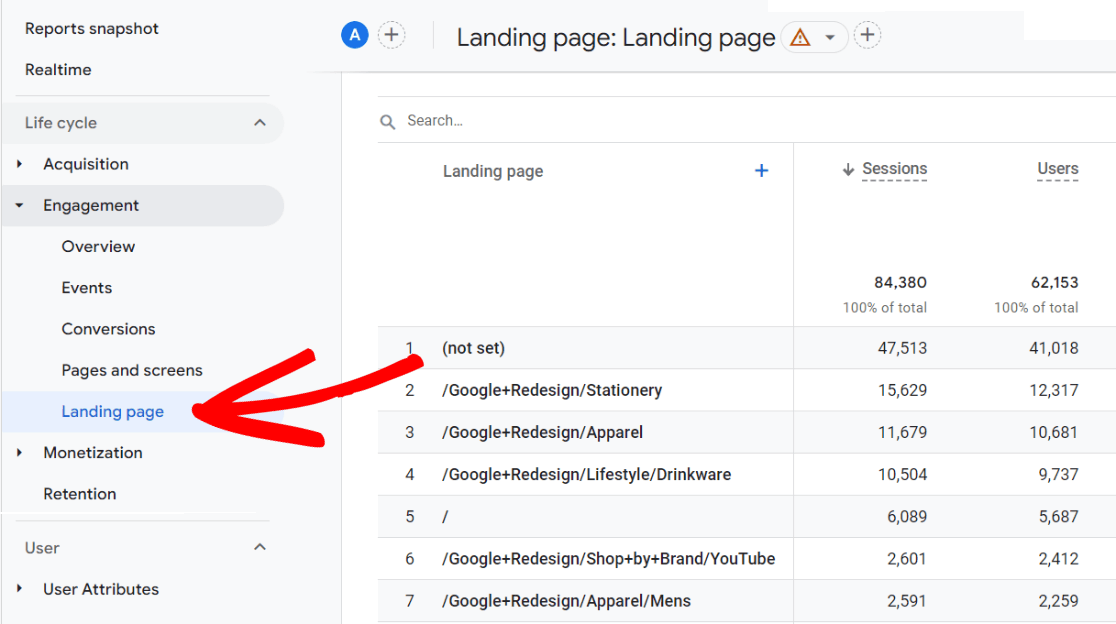
In the same Engagement section, you’ll find a Landing page report. This report has many of the same metrics as the Pages and screens report, but is landing pages (pages your visitors landed on when they visited your site) instead of all pages.
Monetization Report
The monetization report is a report for eCommerce websites that sell products (whether they’re physical or digital).
If you do sell through your website, you’ll have to set up eCommerce tracking in order to track those sales.
If you have WordPress, you can learn more about setting up eCommerce tracking with MonsterInsights.
If you don’t have WordPress, you’ll want to look into setting it up using Google Tag Manager.
Once you’ve got eCommerce running, the Monetization report will show you eCommerce metrics for each of your products:

Demographics Report
The demographics report tells you more about your audience, like where they’re from, gender, age, and language.
This can help you understand your audience and tailor your content for them.
Note that for some demographics to be collected, you’ll need to turn on demographics tracking.

Tech Report
The tech report tells you what technology your users used to visit your site, whether they were on desktop, mobile, or a tablet.
You can also learn their operating system, browser, and screen resolution.

That’s our rundown of the reports in Google Analytics 4.
The more time you spend looking at them and playing around with them, the better you’ll get at finding meaningful data.
Once you’ve got the hang of the basic reports, you can try creating custom Explore reports.
For an even more in-depth guide to all of the reports, check out Google Analytics Reports: The Ultimate Guide.
Now, let’s take a look at a much easier way to use Google Analytics for WordPress users.
MonsterInsights Makes Google Analytics Easier
MonsterInsights is the most user-friendly Google Analytics plugin for WordPress.
It enables anyone, including beginners, to install, set up and use Google Analytics in WordPress easily, without having to touch any code.
MonsterInsights offers different reports that make finding meaningful data in Google Analytics very easy.
Overview Report
First, it’s the website overview report. You can see a graphical presentation of the sessions and pageviews for your site.
Then, below that, you’ll see the total number of sessions, total page views, average duration per session, and total users.

Below the top graph, you’ll also see these metrics in the overview report:
- All-time stats
- Most popular page
- Most popular post
- Most popular times
- Most popular categories
- Most popular products
- New vs. returning users
- Device breakdown – Proportion of users on desktop, tablet, and mobile
- Top 10 countries your visitors are from
- Top 10 referral websites sending you traffic
- Top posts/pages
Traffic Report
The second MonsterInsights report section is Traffic.
Within this section, you’ll be able to access six different reports with vital information about your traffic, including what channels they used to find your website, what devices they were using, what landing pages they landed on, whether or not they converted, and more.

Publishers Reports
The next report section you can view in the MonsterInsights dashboard is the Publishers section.
There, you’ll find your top landing pages, top outbound links, top affiliate links, top download links, demographics, scroll depth, top countries and regions, all of your top most-visited pages with extra details, and interest categories in these reports.

Search Console Report
The fourth report tab is the Search Console report where you can view the top search queries your users use on search engines to find your site.
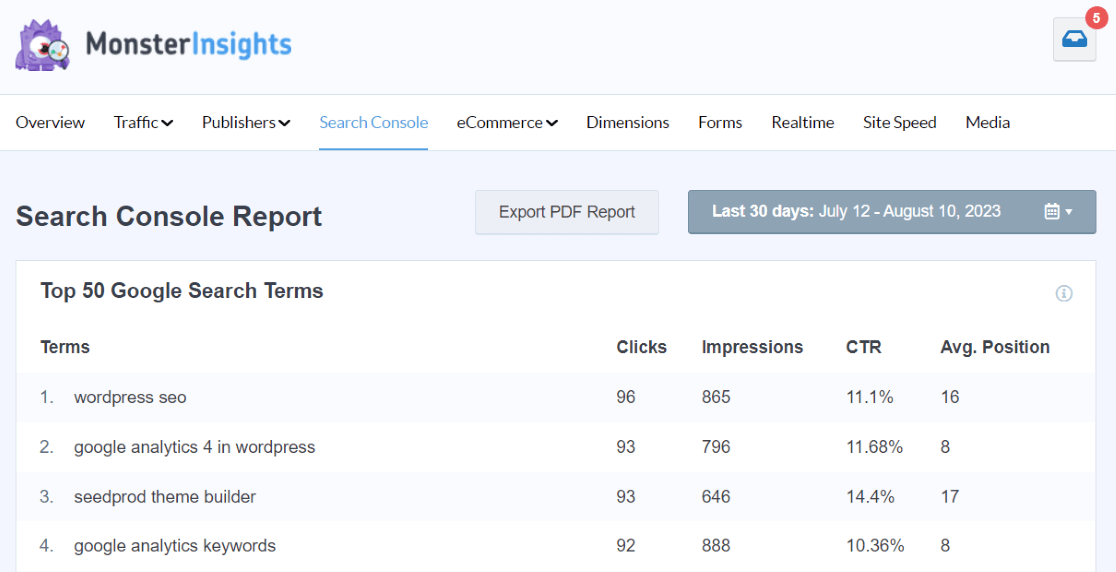
Learn more about connecting MonsterInsights and Google Search Console.
eCommerce Report
Also in MonsterInsights is the eCommerce report, which provides a great overview of your online shop’s performance.
You can view your shop’s conversion rate, the number of transactions, how much revenue you’ve generated, and your average order value.
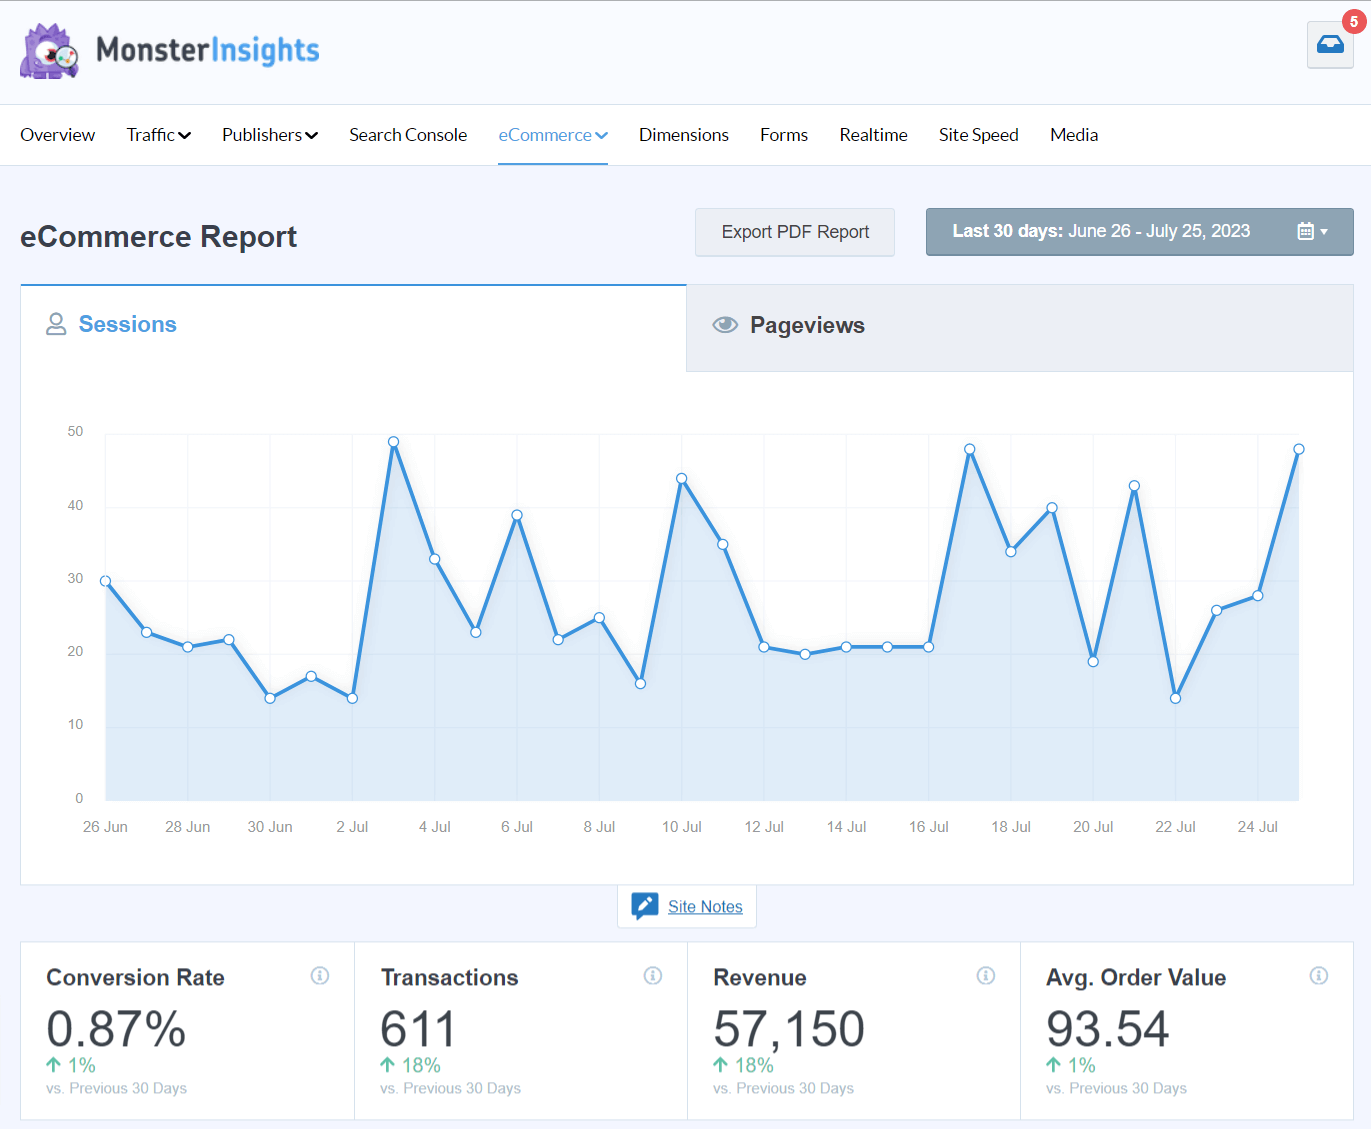
Plus, you can see the list of your top products and many more useful metrics about your online shop.
Other eCommerce reports include:
- Coupons report
- Shopping funnel report
- Cart abandonment report
User Journey Report
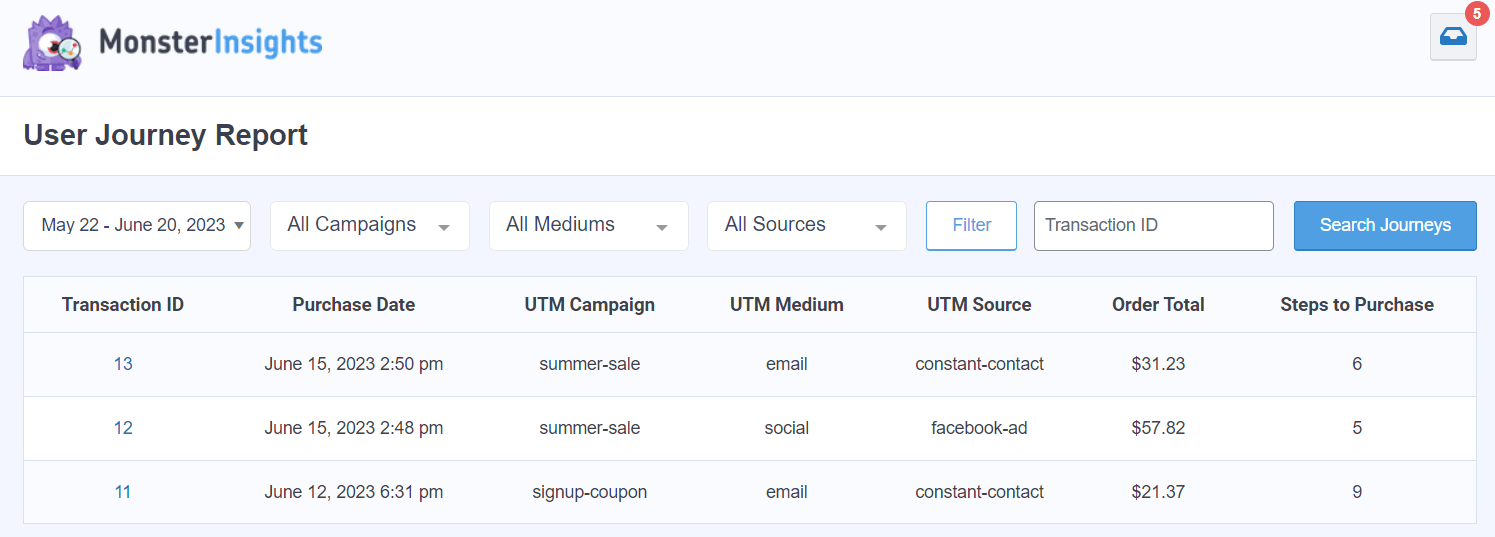
The User Journey report shows you the steps users took when they made a purchase on your eCommerce website.
This report isn’t in the top navigation inside the MonsterInsights dashboard, but you can reach it by navigating to Insights » User Journey:
Custom Dimensions Report
The next report is the Custom Dimensions Report. This is where you can set up and track helpful data that Google Analytics doesn’t track out of the box on its own, including:
- The most popular authors on your site
- Which keywords you’ve used on your site are bringing in the most traffic
- Top categories and tags on your site
- Logged in users

For more on MonsterInsights custom dimensions, check out The Beginner’s Guide to Google Analytics Custom Dimensions.
Forms Report
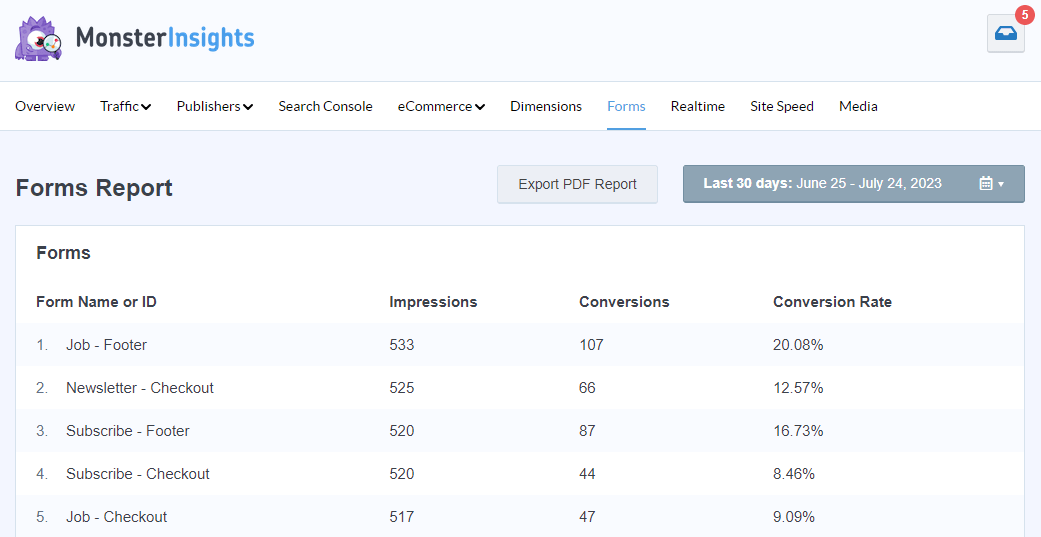
Next in MonsterInsights is the Forms Report. It automatically tracks all the forms on your site without any setup (beyond installing our addon) and gives you data on their conversion rate and submissions.
Realtime Report
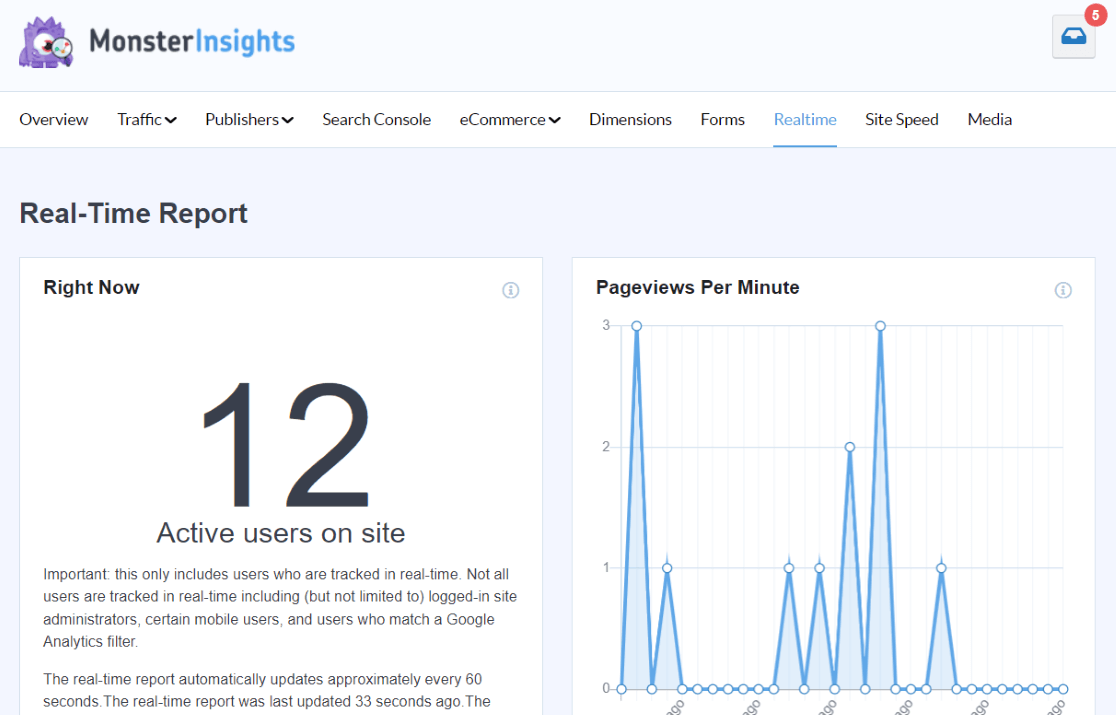
Do you like following your traffic immediately after sending out email or social media campaigns?
Open the MonsterInsights Real-Time Report to see how many people are currently on your site, what pages they’re on, and where they’re from.
Site Speed Report
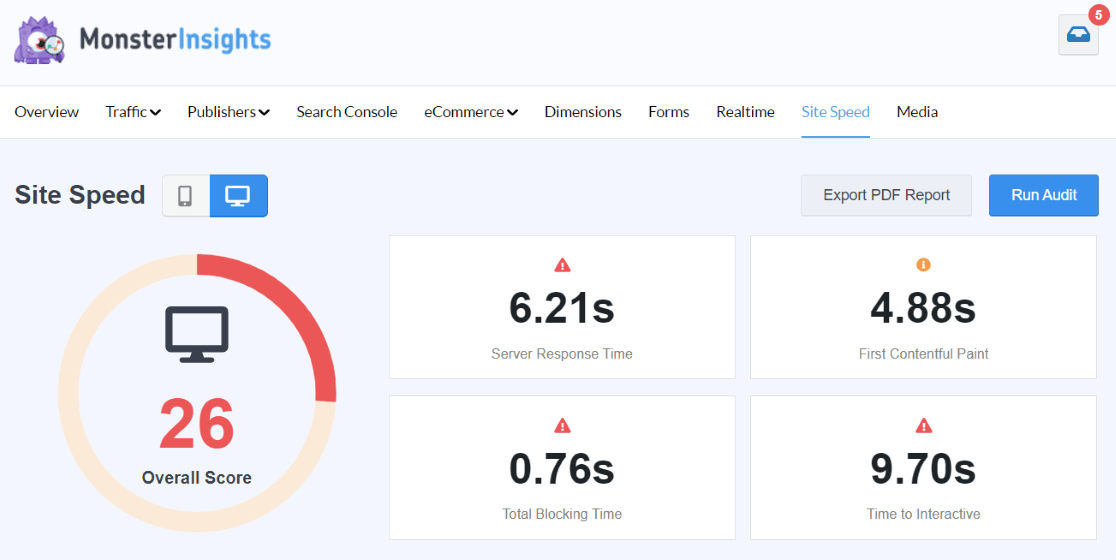
The speed of your website can impact a lot of things, including how you rank in search and how much organic traffic you get. That’s really important!
So, you can access your up-to-the-minute site speed report inside MonsterInsights at any time.
Media
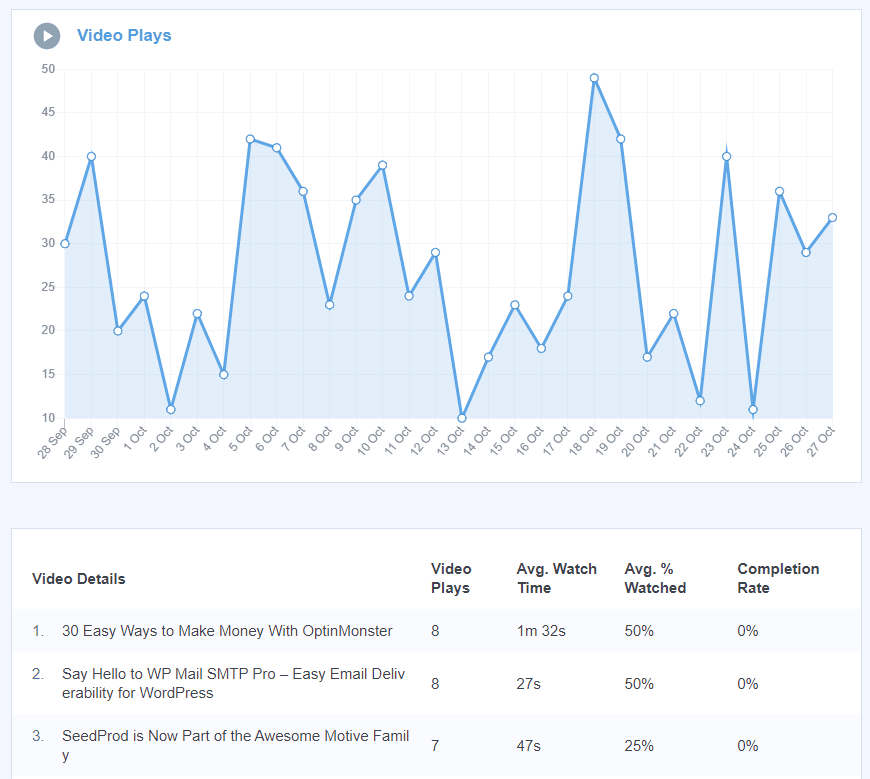
Do you have videos embedded on your website?
If so, you can see how many times they’re getting watched with the MonsterInsights media report.
Those are the reports you’ll find inside MonsterInsights, but don’t forget about Site Notes!
Head to Insights » Site Notes to take notes about all your important marketing or design activities and keep track of what you did, when:

Get started with MonsterInsights now!
These metrics are necessary for gaining deep insights into your website visitor base.
By using this data, you can refine your marketing strategies, enhance your SEO efforts, and significantly boost your conversion rates. Understanding your audience is the key to growing your business!
I hope this article helped you understand how Google Analytics works.
Here are a few more articles you might want to check out:
- Top Important Google Analytics Metrics to Track
- MonsterInsights vs. Google Analytics – What’s the Real Difference?
- Best Ways to Learn Google Analytics: Courses, Training, and More
- How to Use Google Analytics and AI to Grow Faster 🚀
Finally, don’t forget to follow us on YouTube for more helpful Google Analytics tips.
Google Analytics FAQ
Is Google Analytics completely free?
Yes, the standard version of Google Analytics is completely free for most businesses. There is a paid version called Google Analytics 360 for enterprise-level organizations with very high traffic volumes (over 10 million hits per month) or those needing advanced features, SLAs, and dedicated support.
How does Google Analytics track users?
Google Analytics tracks users through a JavaScript tracking code that’s placed on your website. When someone visits your site, this code drops cookies on their browser, which collects information about their behavior. GA4 also uses machine learning and modeling to fill in data gaps when cookies aren’t available due to privacy settings.
How accurate is Google Analytics data?
Google Analytics data is generally quite accurate, but several factors can affect its precision. These include ad blockers (which can prevent tracking), sampling (for sites with very high traffic), cookie rejection, and tracking code implementation issues. Most businesses can rely on GA data for making informed decisions while understanding these limitations.
How do I connect Google Analytics to my social media accounts?
Google Analytics doesn’t directly connect to social media accounts, but it can track traffic from social media platforms. To measure social media performance, you can use UTM parameters in your social media links, set up social media referral tracking in GA4, or use MonsterInsights for WordPress sites to automatically categorize and track social media traffic. To learn more about social media tracking, check out How to Set up Google Analytics Social Media Tracking.
How long does it take for Google Analytics to start showing data?
Google Analytics begins collecting data as soon as the tracking code is properly installed on your website. You should see data appearing in your real-time reports immediately. However, standard reports typically update within 24-48 hours. If you’re not seeing data after 24 hours, you may need to check your implementation.
What are the limitations of the free version of Google Analytics?
The free version of Google Analytics has some limitations, including a maximum of 10 million hits per month, data sampling for large datasets, 100 custom dimensions and metrics, and limited data retention options. For most small to medium-sized businesses, these limitations won’t affect your analytics capabilities.

Awesome resources!
Thanks for sharing such good article. This is really helpful.
Good write-up! Thanks for posting such useful content. Much obliged!
INTERESTING
This is truly amazing. I was looking at how to use Google Analytics and this website post came at the right time. Thank you so much for the information and I truly appreciate your team has done.
It helpful !
Great content, thanks for sharing.
Thanks for sharing such good article. This is really helpful.
Interesting. Thanks for posting.
Thanks, easy to understand
Wow, what a fantastic beginner’s guide to Google Analytics! As someone who has just started exploring the world of website analytics, I found this article to be incredibly helpful and informative. The way you explained the basics of Google Analytics and its key features was clear and easy to understand. Thanks for such a great resource !
I think this article is best recommended to complete beginners – but good job!
Thank you, this is very helpful for a beginner such as myself.
Thank you, this is very helpful for a beginner such as myself.
Great step-by-step tutorial with good, clear explanations.
Interesting.
That’s the only one people waiting, for now, I can tell you that if you are a beginner and have a lot of doubt about how to do it and you have already watched a lot of videos on youtube then I would suggest you just go through this mind-blowing blog because it’s very easy to understand this plugin in a simple way where you don’t need to visit again and again search console or google analytics in one place you can explore everything that you want to analysis your data by views by revenue, by engagement, a country many more I bet you are not gonna confuse because I’m dumb and this blog helped me a lot you won’t need to go anywhere to understand.
Best Google Analytics How To Setup for Beginners that I have found on the internet! Thank you so much for breaking it down and showing me exactly what to do, step by step. Sigh of relief. Many thanks!
Yes, I agree that MonsterInsights makes using GA easier. I think the advice and support provided by MI also makes my sites more effective.
I am curious to see what tweaks MI makes as AI becomes more advanced. I know this is unrelated to AI, but does the use of AI make it at all easier to provide a dashboard that allows users to monitor MI and GA across multiple sites?
This was helpful info. We are diligently moving clients to GA4 but it is a beast, Your article will help make the transition easier
Well known plugin
very informative and useful article on the use cases and importance of Google analytics
This was a great share and covers so many aspects I got aware of now. I have been using Google Analytics for quite some time now and was missing a few things which I got to know about them here.
Thank you so much for sharing that. Keep posting.
That’s really interesting!
I’ve migrated my sites to GA4 but haven’t had success in setting everything up quite right. Your comprehensive post will certainly help me though! Thank you for taking the time to walk readers through the updates.
Awesome plugin!
Bookmarking this article – such a great resource! Google Analytics is hard, especially for someone who is more creative and less detail oriented. This is a great walkthrough to help me get on top of this useful resource!
Interesting..
RH
Site Kit stopped working properly. Every time I try to connect to it, it goes through all the steps, until it gets to this part:
Site Kit wants additional access to your Google Account
where it comes back to my site to my 404 page that says, “Oops, that’s wrong answer.”
I’ve uninstalled it and reinstalled it without success. Help.
Hi there – I can’t provide support for Site Kit, but I definitely recommend trying MonsterInsights instead. You can start with the Lite version if needed: https://wordpress.org/plugins/google-analytics-for-wordpress/