Ever feel like you’re playing a guessing game with your website? You know your visitors are on your site, clicking around, but what are they actually doing? And, more importantly, how can you use that information to grow your business?
Enter user behavior analytics—the secret sauce to understanding your audience and amping up your website’s performance.
In this article, I’ll break down everything you need to know about user behavior analytics. I’ll explain what it is, why it’s a game-changer, and how you can use it to take your business to the next level. I’ll walk you through key user behavior metrics, introduce you to some awesome tools, and share practical tips on how to put all of this data to work.
Let’s dive in.
What is user behavior analytics?
In simple terms, user behavior analytics (UBA) is the process of collecting, analyzing, and interpreting data about how users interact with your website or app.
UBA goes beyond counting page views or tracking clicks to determine your most popular content or the number of conversions you received. Instead, it looks deeper into the details of user actions, helping you see exactly how your visitors use your website and interact with your content.
User behavior analytics typically includes data like:
- Click patterns: Where are users clicking on your pages?
- Scroll depth: How far down are they scrolling on your content?
- Time on page: How long are they spending on each page?
- Navigation paths: What route are they taking through your site?
- Form interactions: How are they engaging with your forms?
- Mouse movements: Where are their cursors hovering?
By looking at that user behavior data, you can gain valuable insights into what’s working on your site, what’s not, and where there might be opportunities for improvement. It guides you through how to make your website more user-friendly and effective!
While user behavior analytics can be used for security purposes (like detecting unusual patterns that might indicate fraud), I’ll focus mostly on how it can help you optimize your website to better serve your visitors and grow your business.
What can user behavior analytics tell you?
User behavior analytics can tell you AND show you what your users are doing on your website. Using a combination of a few different tools, you can get a pretty exact picture of what’s going on.
Here are some of the things you’ll be able to learn thanks to your user behavior analytics:
- How engaging is your content? User behavior analytics can show you which pages keep visitors glued to their screens and which ones make them hit the back button faster than you can say “bounce rate.” You’ll see metrics like time on page, scroll depth, and exit rates that paint a clear picture of content engagement.
- Where are users getting stuck? Ever wonder why your conversion rates aren’t as high as you’d like? User behavior analytics can highlight where users are dropping off in your sales funnel or where they’re encountering friction on your site. This information is gold for improving your user experience and boosting conversions.
- What’s catching users’ attention? Heatmaps and click maps show you exactly where users are clicking, scrolling, and hovering their cursors. This visual data can reveal which elements of your page are eye-catching and which might be getting overlooked.
- How are users navigating your site? User flow reports show the paths visitors take through your site. This can help you understand if users are finding what they need easily or if they’re taking unexpected detours.
- Which devices are your visitors using? User behavior can vary significantly between desktop and mobile users. Analytics can show you how the user experience differs across devices, helping you optimize for all types of visitors.
- Are your CTAs effective? By tracking clicks on buttons and links, you can see which calls-to-action (CTAs) are resonating with your audience and which ones might need a makeover.
- How do different user segments behave? Not all visitors are created equal. User behavior analytics allows you to segment your audience and see how different groups interact with your site. This can be incredibly useful for personalization efforts.
- Are there any technical issues? Sometimes, user behavior can alert you to technical problems. For example, if users are rapidly clicking in a specific area, it might indicate a broken link or button.
There are so many things you can learn from user behavior analytics if you know how to collect the data and where to look. So, I’ll go over some of the tools you might want to have in your arsenal to get the right insights, improve your website, and grow your business.
6 Best User Behavior Analytics Tools
There’s a really long list out there of user behavior analytics tools that you can use to help you gather behavior data and make website and product improvements. Instead of giving you a huge list that you have to sort through, I’m going to focus on 6 of the top tools.
1. Google Analytics
Google Analytics is a free website and app analytics tool by Google. Because it’s free and created by Google, it’s the most widely used analytics tool out there. It’s able to track a huge number of metrics, including many user behavior metrics.
When you add the Google Analytics tracking script to your website, you’ll get reports like:
- Top landing pages
- Landing page engagement
- Traffic channels (like organic, referral, and direct)
- Real-time users
- Users by geographical area
- Users by device
- And more
Google Analytics is the biggest and most powerful web analytics tool available for free. However, because it’s so big and powerful, it can be difficult to learn how to use it correctly. You’ll also want to take advantage of some of its tracking capabilities that aren’t set up automatically.
That’s why the next tool on our list can help you easily get more out of Google Analytics without hiring a developer!
Get started with Google Analytics now.
2. MonsterInsights

MonsterInsights is a WordPress plugin that connects your website with Google Analytics, installs the tracking code for you, and easily adds tracking features to Google Analytics that it doesn’t come with out of the box.
So, if you have a WordPress site and you use Google Analytics, installing MonsterInsights is the best way to set up those extra tracking features and get easy-to-understand reports without having to hire a developer or spend many hours learning Google Analytics.
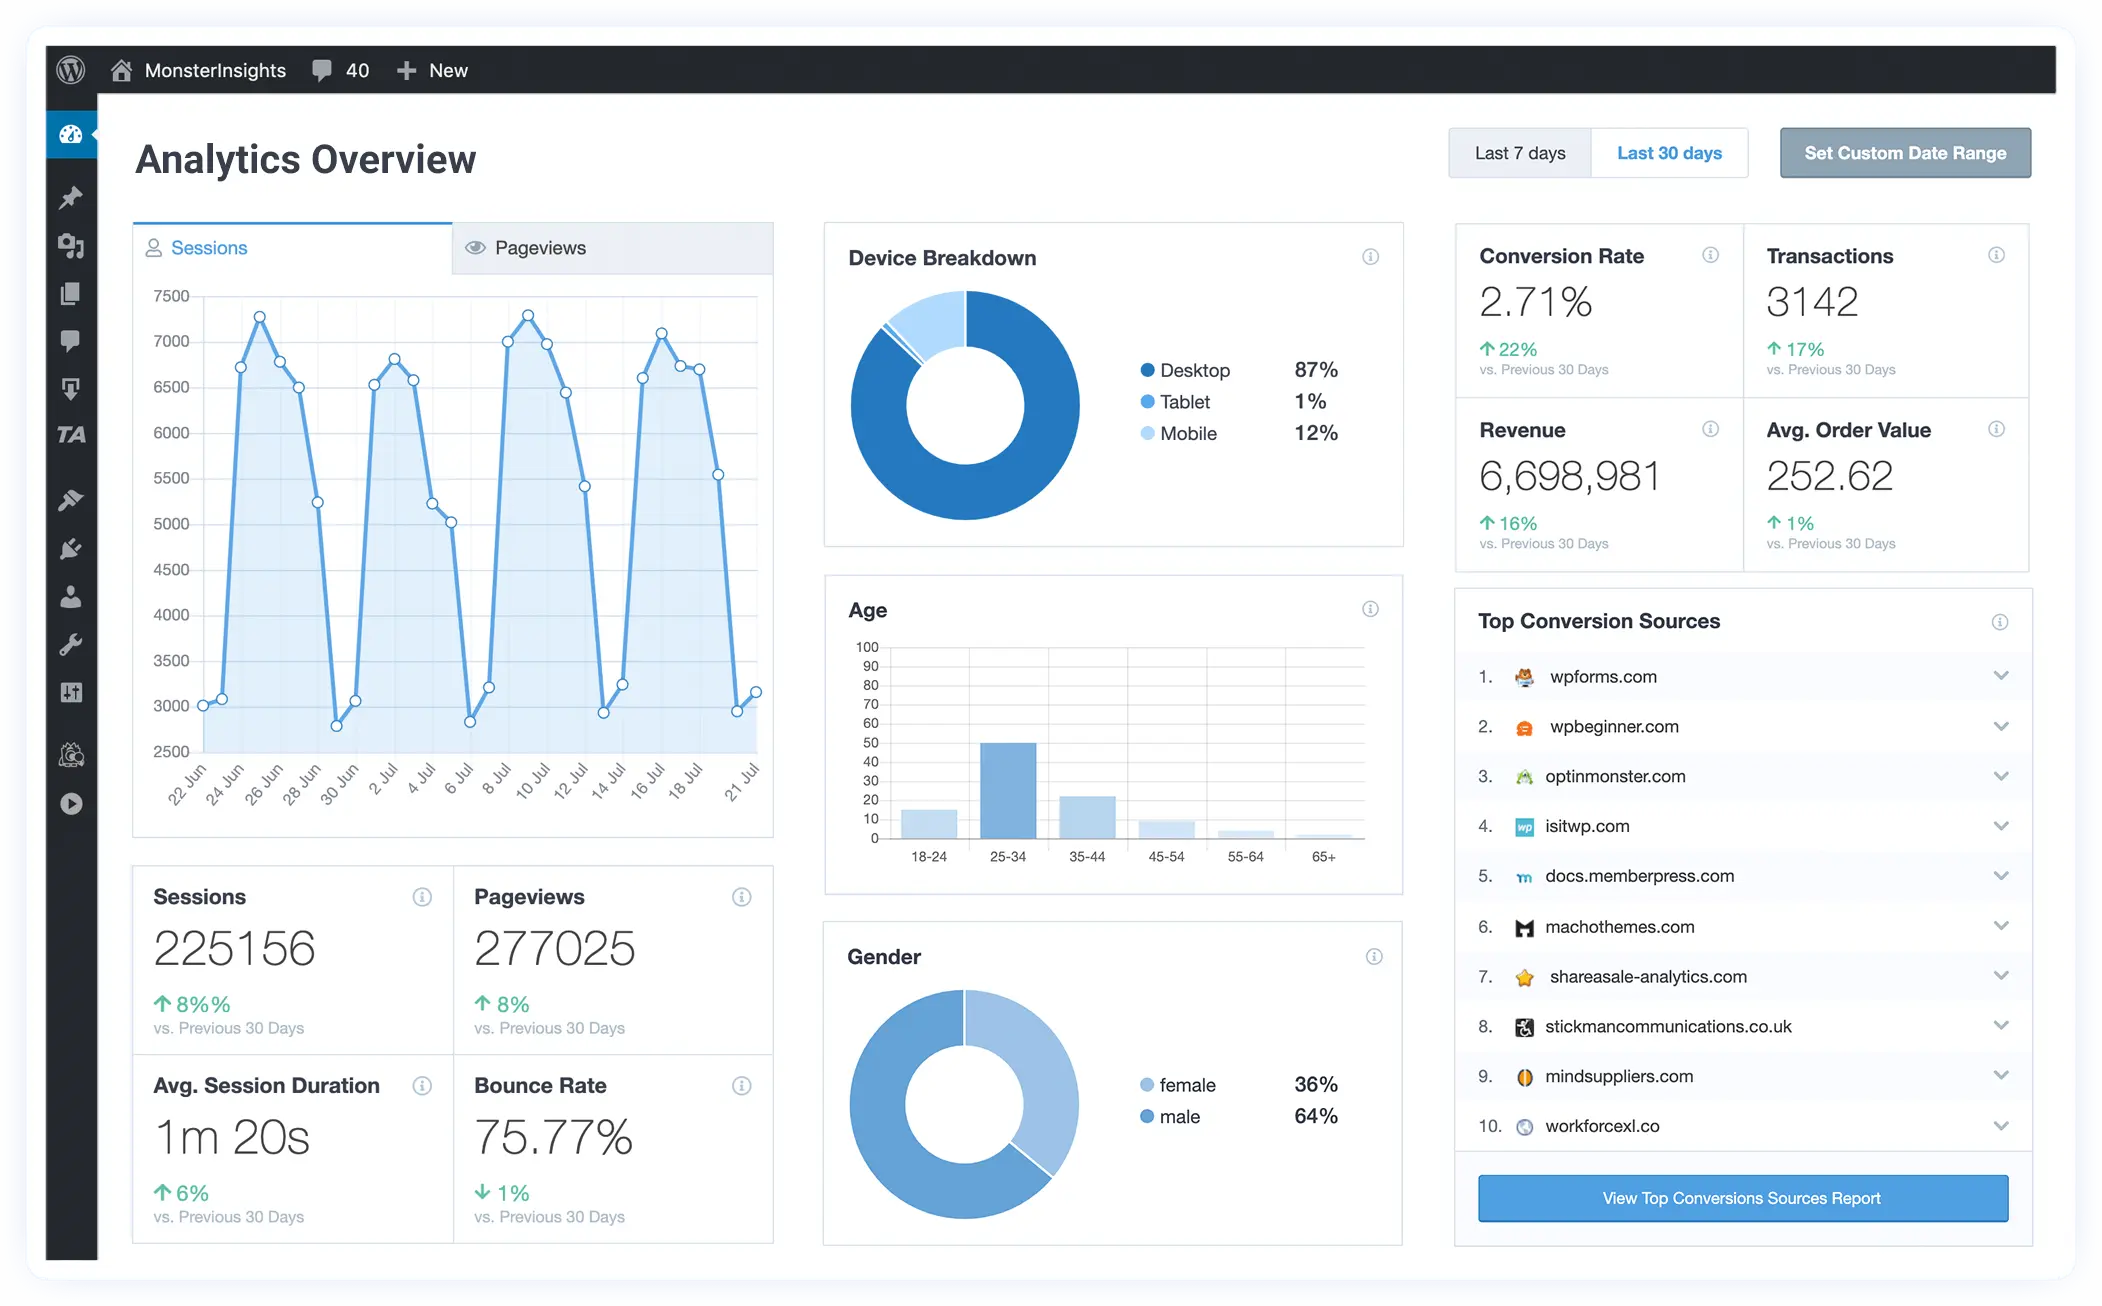
Plus, you’ll get important user behavior data right inside your WordPress dashboard, including:
- Conversions
- eCommerce purchases
- Bounce rate/engagement rate
- Average scroll depth
- eCommerce user journey
- Abandoned purchase funnels
- Page engagement
- And more
Get started with MonsterInsights now.
3. UserFeedback
UserFeedback is a popular user feedback plugin for WordPress. User feedback is an incredibly important part of user behavior analytics, so you need a plan to capture it! UserFeedback makes it easy to create everything from simple, one-question feedback forms to multi-question surveys and more.
Plus, UserFeedback integrates directly with Google Analytics, so you can find out more about the people who are submitting your survey forms. That’s increasing your user behavior data!
More of the features that make UserFeedback an awesome choice are:
- Page-level targeting
- Conditional survey questions
- Unlimited questions and surveys
- Integrates with Google Analytics
- Simple reporting
- And more
Get started with UserFeedback now.
4. Microsoft Clarity
Microsoft Clarity is a free heat mapping and user behavior analysis tool. It provides you with heatmaps, session recordings, and analytics to help you make data-driven improvements to your website.
Heatmaps are snapshots of your website pages with colors overlayed to show how popular your click elements are and how far down the page your users are scrolling. See if your CTAs are working, your forms are being seen, your navigation is being used as intended, and more.
Session recordings are actual video recordings of a user’s mouse movements on your site during their session. You can see the path they took, the buttons they clicked, how far down they scrolled, and more. It also integrates with Google Analytics to help you see how different segments of your visitors navigate your site.
Everything that Microsoft Clarity provides is important user behavior data!
Get started with Microsoft Clarity now.
5. Crazy Egg
Crazy Egg is a tool that’s similar to Microsoft Clarity, but it adds some extra features and is a paid tool. It can also capture heatmaps and session recordings plus help you run A/B tests, track errors and conversions, launch surveys, and more.
It also includes a traffic analysis tool that helps you compare how traffic from different channels performs on your site. For example, you can compare what traffic from social media is doing on your site vs. what your organic search traffic is doing.
Overall, the user behavior data that Crazy Egg can provide you with is pretty essential to growing your business!
Get started with Crazy Egg now.
Crazy Egg alternative: Hotjar
6. Amplitude
Amplitude is a Google Analytics alternative that combines many of the features I’ve discussed so far into one big platform. Like Google Analytics, it tracks your most important web analytics metrics and also includes session recordings, user journey reports, and A/B testing capabilities.
While it’s a pretty cool tool, it does get pretty expensive for the average business owner unless you have less than 50,000 monthly tracked users.
Get started with Amplitude now.
7 Key Metrics in User Behavior Analytics
Which metrics should you focus on in your user behavior data? While there are a ton of metrics that can indicate how your users are behaving, here are some of the top ones that you’ll want to start with.
I’ll show you how to find them inside Google Analytics wherever possible.
1. User Engagement
User engagement consists of a few metrics, and they’re super important to monitor together. They’re lumped together here because you can find them in the same reports in Google Analytics.
To monitor user engagement, keep your eye on:
- Engaged sessions (last longer than 10 seconds, a second page is visited, or a key event/conversion is recorded)
- Engagement rate
- Average engagement time per session and page
You can find these engagement metrics in several different places in Google Analytics, but I recommend looking at them in the Acquisition » Traffic acquisition report. Here, you’ll find your engagement rate (the percentage of your sessions that counted as engaged) depending on the channel that was used to visit your site:

For more on tracking engagement metrics, check out Top 5 Website User Engagement Metrics in Google Analytics (GA4).
2. Stickiness
Stickiness is another user behavior analytics metric that you’ll find in Google Analytics. Instead of how long user spends on your site or how many things they click on, this metric tracks how much of your traffic is returning to your site on a regular basis.
You’ll find it under Engagement » Overview in Google Analytics:

Here’s what the acronyms in this report mean:
- Daily Active Users (DAU): the number of active users in the last 24 hours
- Weekly Active Users (WAU): the number of active users in the last 7 days
- Monthly Active Users (MAU): the number of active users in the last 30 days
These percentages show how “sticky” your users are or how often they return. The higher these percentages, the more often your users return to your site.
The bottom line is Weekly Active Users divided by Monthly Active Users, which shows how many of your visitors this month also visited weekly.
The top line, then, shows how many of your Monthly Active Users visited daily.
So, if you have 50 Daily Active Users and 100 Monthly Active Users, that means half of your users visit your site daily.
3. Conversions
Conversions (now called Key Events in Google Analytics) are actions your visitors take that you decide should count as a “win” for your site. If you sell products, your conversions might be sales and email entries in your coupon pop-up message. If you’re a nonprofit, your conversions might be donations and newsletter signups. If you’re a plumber, your conversions might be clicking on your phone number to call you or submitting your service request form.
No matter what your conversions are, tracking them in Google Analytics makes them super valuable user behavior metrics because you can apply them to many different reports. You could look at which landing pages brought in the most conversions, which traffic channel brought them in, which geographical area, and more.

Here’s a list of actions you might want to count as conversions on your website:
- Completing a purchase
- Submitting a form
- Clicking a phone number
- Watching a video
- Completing a donation
- Downloading a file
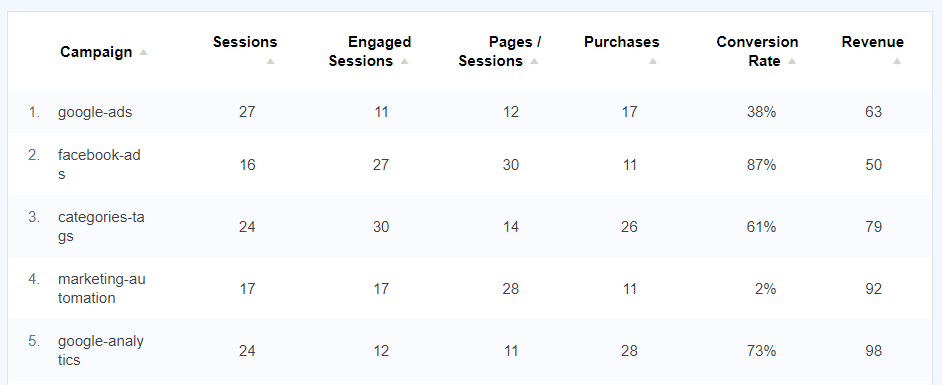
Setting up conversion tracking in Google Analytics can be a little bit tricky. If you’re using MonsterInsights, though, you can set up any of the above conversions in a couple of clicks and see many of your conversions inside your WordPress dashboard (like in this Campaigns report):

For more on conversion tracking, read A Complete Guide to GA4 Conversion Tracking for WordPress.
4. Click Tracking (Heatmaps)
Using heat mapping tools to track clicks on a webpage is an awesome way to gather user behavior data. See what the majority of your visitors are clicking on, along with any important parts they’re missing.

5. Scroll Depth
Scroll depth goes hand-in-hand with heatmaps. It’s usually reported in the same way, using warm-to-cool colors to show where a majority of your visitors stop scrolling down the page.
MonsterInsights reports on your average, site-wide scroll depth right in your WordPress dashboard. It’s also a report you can find in Microsoft Clarity:

6. Path Exploration
The path exploration report is another way to gauge your site’s user behavior. It shows how users navigate your site using a sort of flow chart:

At each step, you can see which pages were the most popular next step in the user’s journey, which ones weren’t so popular, which events users triggered next, and where they dropped off.
For a tutorial on creating the path exploration report, check out How To Use the Google Analytics 4 Behavior Flow Report.
7. Abandoned Funnels
Abandoned funnels can be a little but trickier to measure, but are an important part of user behavior analytics.
On your website, you’ll have different paths that your users might take to convert. These are called funnels because they’re meant to funnel users from the beginning (like an introductory article) to the end of the conversion (like making a purchase).
Funnels don’t have to be different pages. They can be from a page to a popup form to a thank-you page, for example.
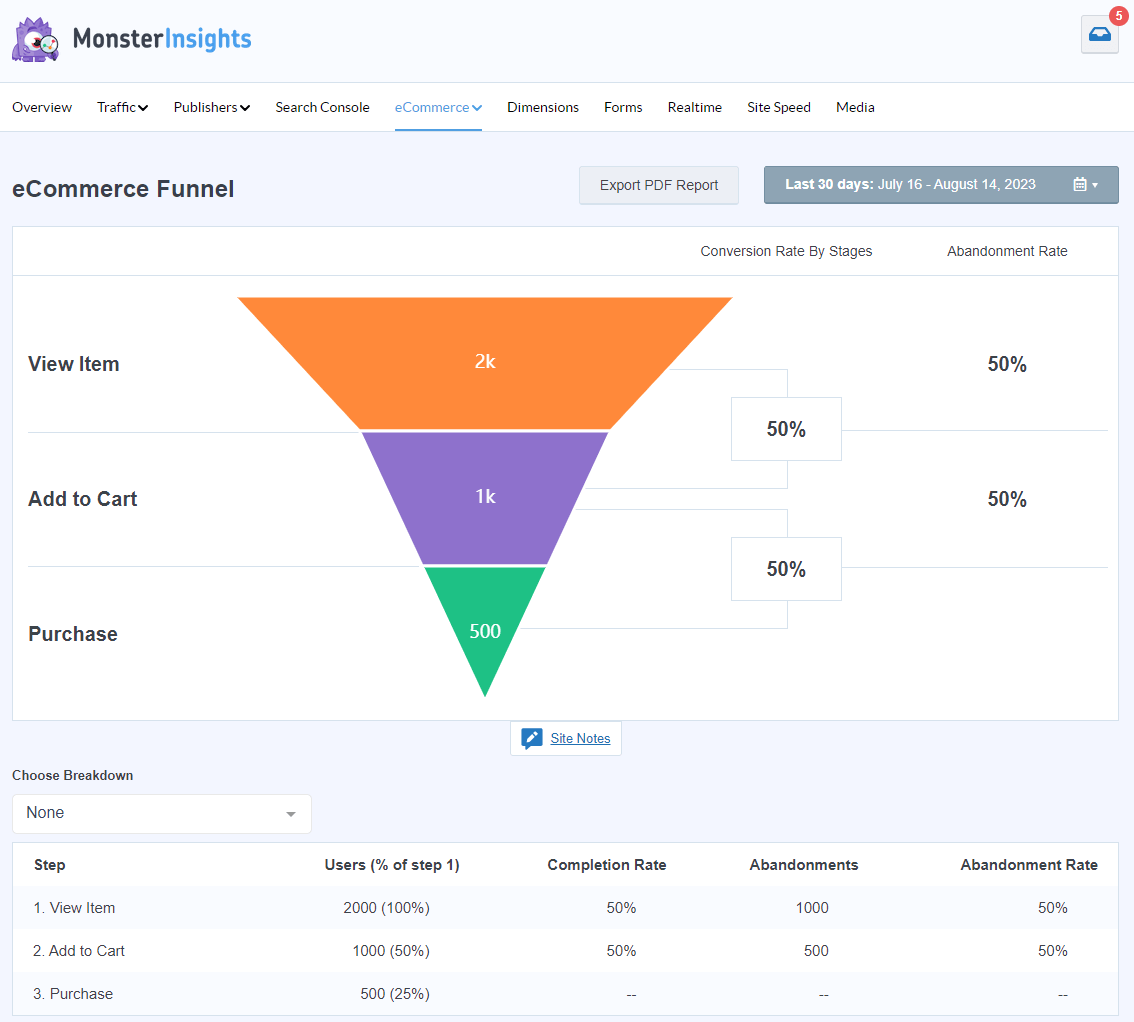
With MonsterInsights, you can track eCommerce funnel drop-offs:

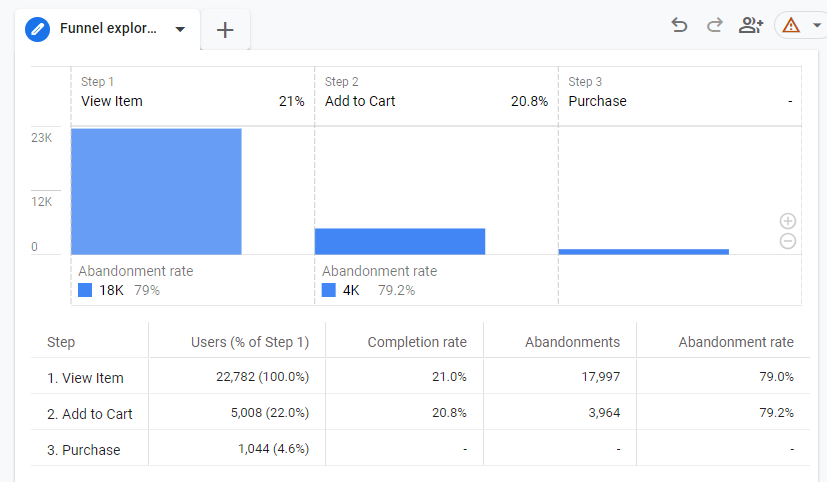
Google Analytics also has its own funnel report builder:

Learn how to use the funnel report builder in our article: GA4 Funnel Exploration Reports: Beginner’s Guide
How to Use User Behavior Analytics to Grow Your Business
Now that you know more about user behavior, what tools you can use to measure it, and which metrics are the top ones to watch, you can think more about what you can do with user behavior analytics to grow your business or brand.
User behavior analytics isn’t just about gathering data; it’s about using that data to make real improvements. By seeing how visitors interact with your site, you can identify problem areas, optimize for better user experiences, and ultimately increase the effectiveness of your website in attracting visitors and turning them into customers or subscribers.
Here are a few user behavior analytics examples that you can use to improve your business:
1. Identify and Remove Friction Points
User behavior analytics can show you exactly where users are getting stuck or frustrated. For example, if you notice a high drop-off rate on a specific form page or a significant decrease in scroll depth before users reach your call-to-action (CTA), that’s a sign something isn’t working. Maybe the form is too long, or the CTA isn’t clear.
Use tools like heatmaps, session recordings, and feedback surveys to see or ask about exactly what’s happening. Once you’ve figured out the potential problems, make the right changes to keep users engaged.
2. Optimize Your Conversion Funnels
Every business has a conversion goal, whether it’s making a sale, getting a newsletter signup, or scheduling a consultation. User behavior analytics helps you track how users move through the different stages of your conversion funnel.
For example, if you notice many users abandoning their carts at checkout, you can take steps to reduce this—perhaps by simplifying the checkout process or offering free shipping.
Learn more about winning back those abandoned carts with our guide: 9 Essential Abandoned Cart Recovery Strategies.
Or, stop abandoned carts before they even happen: 12 Smart Tactics to Reduce Shopping Cart Abandonment
3. Personalize the User Experience
By segmenting your audience, you can learn how different user groups behave on your site. This insight allows you to create more personalized experiences that cater to specific user needs. For example, if mobile users spend less time on your site than desktop users, you might need to enhance your mobile design or offer mobile-specific promotions.
Google Analytics offers tools for segmenting audiences, helping you tailor the user experience for different groups—whether it’s based on device, location, or behavior patterns.
Learn more about segments in our Google Analytics 4 Segments: Beginner’s Guide.
4. Improve Content Engagement
Content is at the heart of most websites, and understanding how users interact with it is crucial. If you see that users are consistently scrolling through your blog posts or spending a long time on certain pages, that’s a sign your content is resonating with them. On the other hand, if they bounce quickly, it might be time to rethink your approach.
Track engagement metrics like scroll depth and average engagement time to see which content types work best. Then, double down on the formats, topics, and styles that keep users engaged.
5. Test and Refine Your Strategies
Once you’ve gathered data, it’s time to experiment. User behavior analytics provides the foundation for A/B testing—comparing different versions of a page to see which one performs better. Tools like Crazy Egg make it easy to test variations of your website, such as changing a headline, CTA placement, or product images.
Don’t have an A/B testing tool? Make one change at a time, set it live, and see if your user behavior metrics improve.
By continuously testing and refining, you’ll make incremental improvements that add up to a better user experience and more conversions over time.
That’s it!
If you’re not using MonsterInsights to track your user behavior analytics yet, get started today.
If you enjoyed this article, you might also want to check out:
How to Use Google Analytics and AI to Grow Faster 🚀
6 Essential Google Analytics Tips for Businesses & Marketers
How to Improve Your Website User Experience (11 Tips)
Finally, don’t forget to follow us on YouTube for more helpful reviews, tutorials, and Google Analytics tips.
FAQ
How do you measure user behavior?
You can measure user behavior with tools like Google Analytics, MonsterInsights, UserFeedback, Microsoft Clarity, and Crazy Egg or Hotjar.
How do you collect user behavior data?
You can collect user behavior data using tools like Google Analytics, heatmaps, session recordings, and surveys. These tools track actions like clicks, scroll depth, and navigation paths. For WordPress sites, tools like MonsterInsights make it super easy to set up user behavior data tracking without needing a developer.
What is an example of user behavior data?
Engagement rate, scroll depth, user stickiness, conversions, and clicks are all examples of user behavior data.
Why is user behavior analytics important?
UBA is crucial because it helps businesses gather valuable insights into user preferences, pain points, and engagement patterns. By analyzing this data, businesses can improve product features, streamline their websites to increase their performance, and make users happier with the experience overall, which drives better results and increases revenue.


