Lost sales due to abandoned shopping carts represent one of the most significant challenges for eCommerce businesses today. With nearly 70% of potential customers leaving items in their cart without completing their purchase, tracking and reducing cart abandonment is essential for increasing your revenue and growing your store.
With Google Analytics eCommerce tracking in WordPress, you can effectively track cart abandonment rates and start using strategies to reduce them, ultimately boosting your revenue.
In this article, I’ll show you exactly how to track shopping cart abandonment with Google Analytics and MonsterInsights, the best Google Analytics plugin for WordPress.
In this article:
Why You Should Track Shopping Cart Abandonment Rate
If you want to reduce your shopping cart abandonment rate and recover those lost sales, you need deeper insights into why people aren’t completing the checkout process.
Here are the key benefits of tracking cart abandonment:
- Understand Customer Behavior – See exactly how people navigate your store and identify where they drop off during checkout
- Correct Errors in Your Checkout Process – Discover technical issues like payment processing errors or form validation problems
- Measure Changes on Your Website – Quantify the impact of checkout design changes or pricing adjustments
- Optimize Your Sales Funnel – Identify which traffic sources, customer journeys, and/or products lead to higher completion rates
Now, let’s dive into how you can track cart abandonment using Google Analytics 4 (GA4).
Tutorial: Track Cart Abandonment in Google Analytics (GA4)
The easiest way to track shopping cart abandonment on your site is with MonsterInsights. It’s the best Google Analytics WordPress plugin and helps you easily set up advanced tracking that doesn’t come standard with Google Analytics. That includes eCommerce tracking, shopping cart abandonment tracking, user journeys, form submission tracking, and much more.
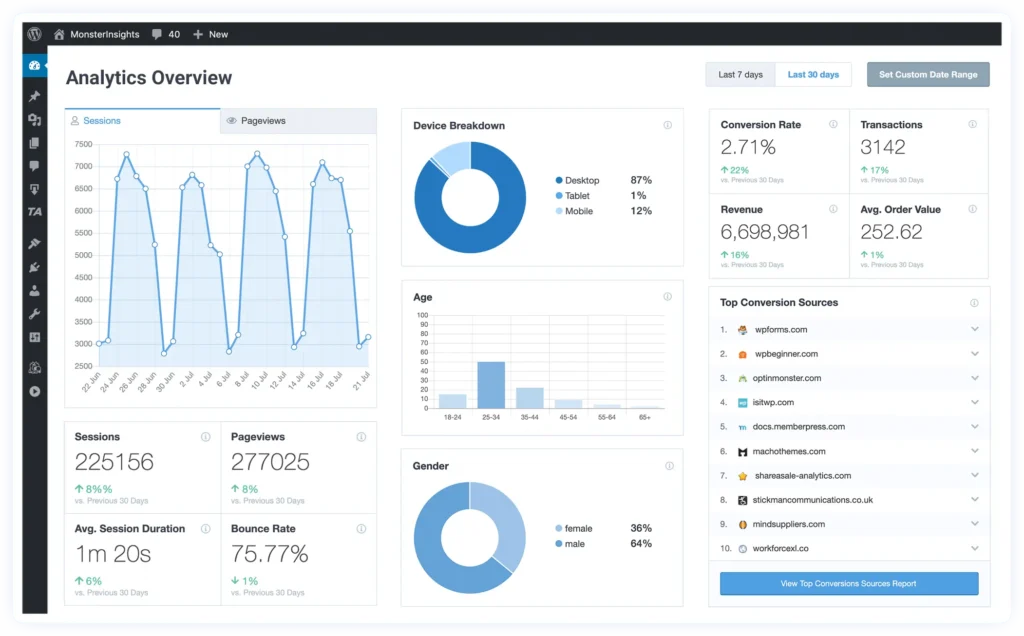
To get started, follow these quick steps:
Step 1: Install and Activate MonsterInsights
To set up tracking for your eCommerce store, grab MonsterInsights at the Pro level or above.
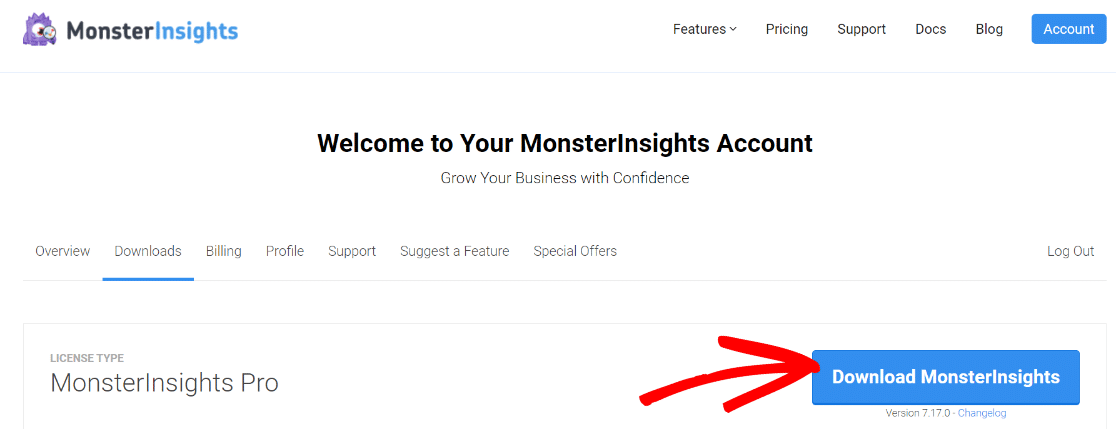
Once you’re set up with the Pro version of MonsterInsights, log in and go to your account area.
Then, navigate to the Downloads tab and click Download MonsterInsights.
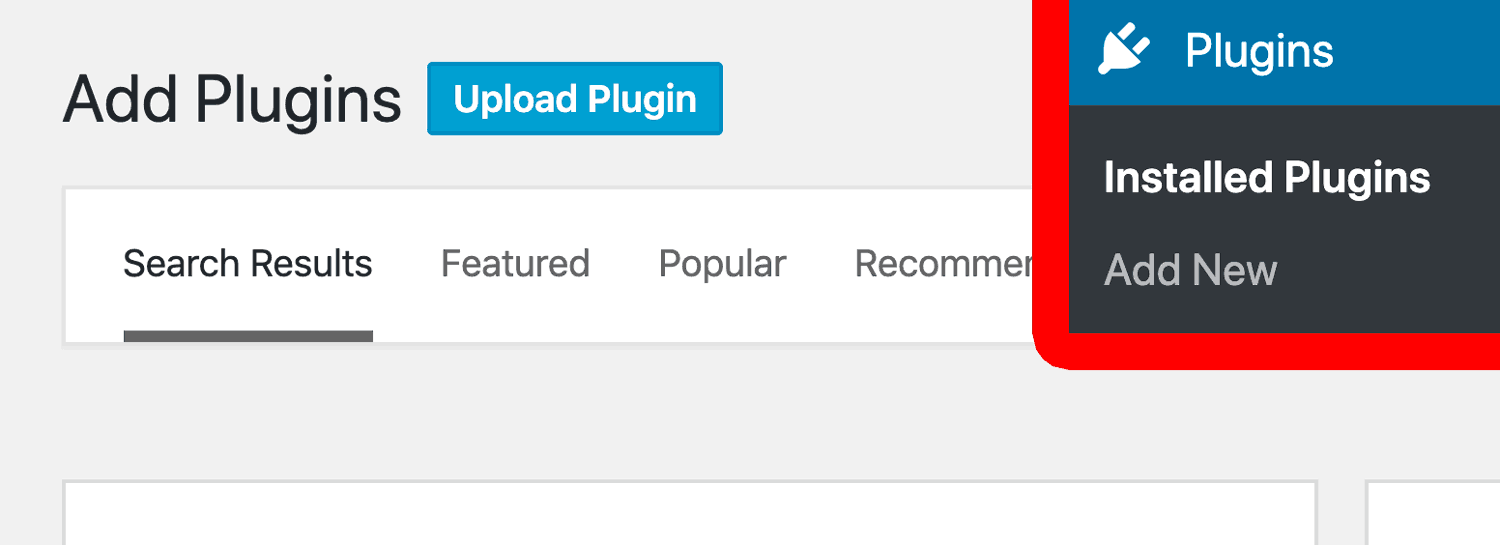
Now, go to your WordPress site’s admin and upload the plugin. You can do that by going to Plugins » Add New » Upload Plugin.
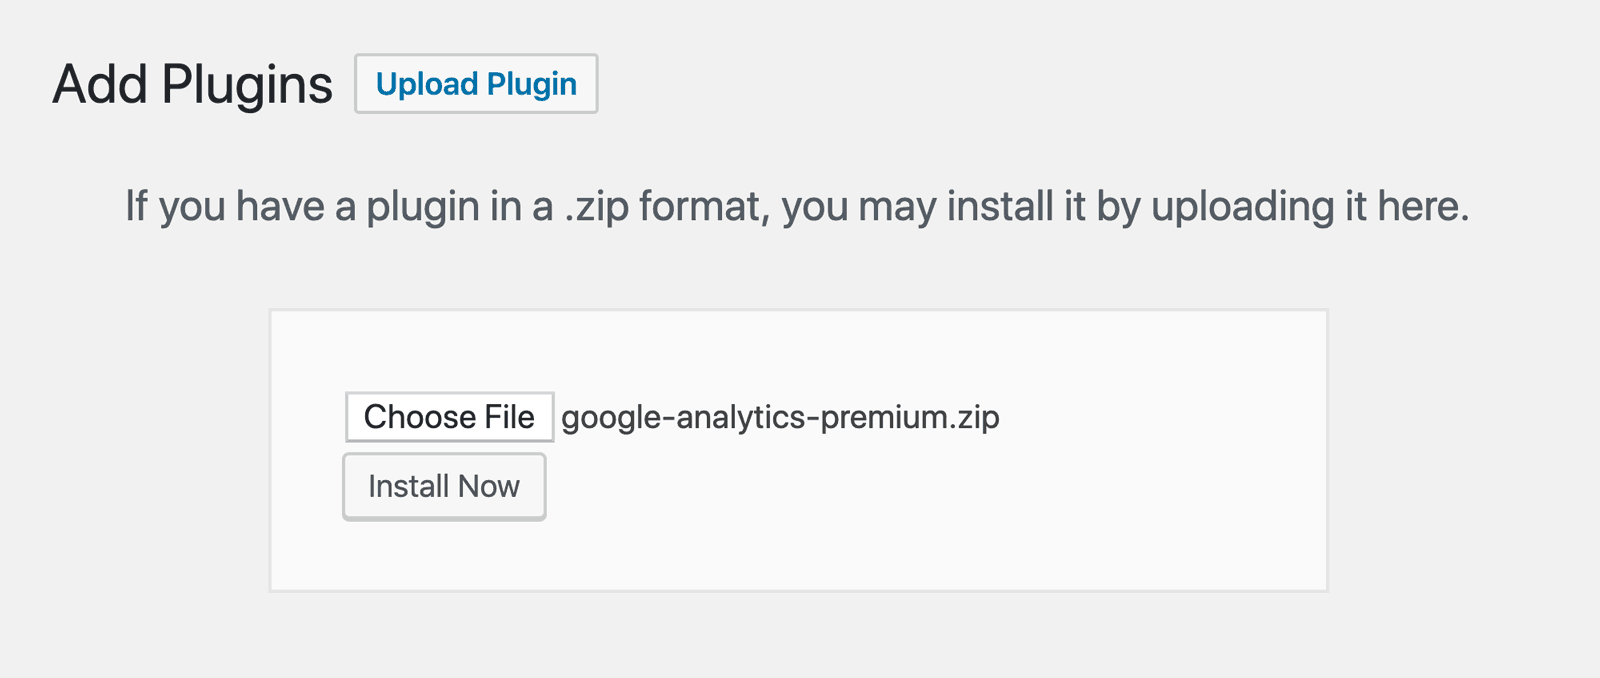
Next, click on Choose File and select the MonsterInsights ZIP file. Click Install Now.
Once the plugin installs, click Activate Plugin.
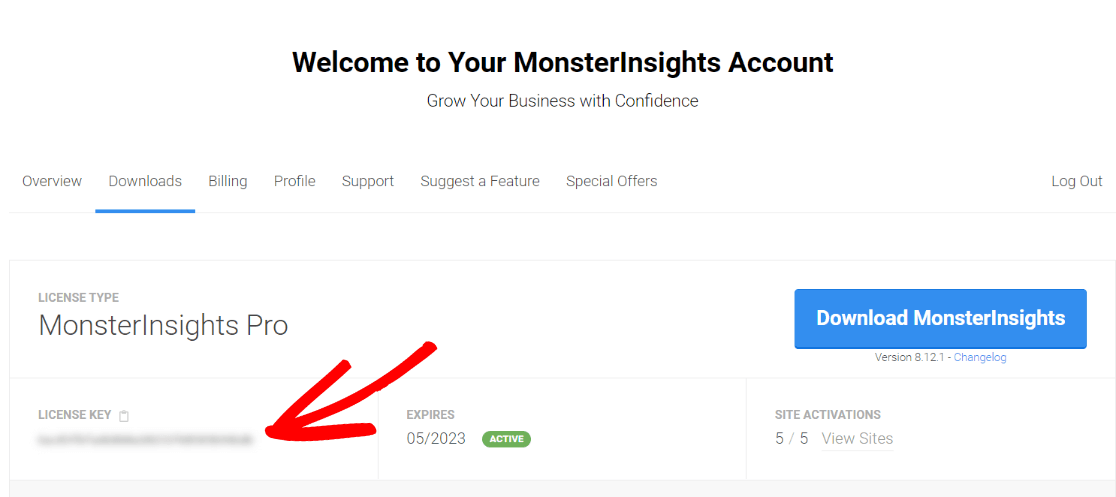
To configure MonsterInsights and connect to your Google Analytics account, you’ll need to verify your license key in the plugin. You can find the key in your account area in the Downloads tab. Simply copy the license key.
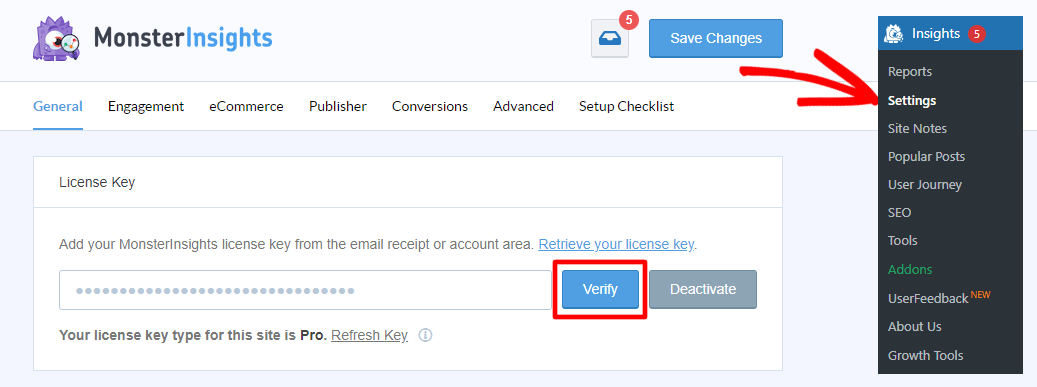
If you’ve gone through the MonsterInsights setup wizard without adding your license key, you can always find it in plugin settings under Settings » General.
For a complete tutorial on setting up MonsterInsights, check out How to Add Google Analytics to WordPress the Right Way.
Step 2: Install the MonsterInsights eCommerce Addon
Now that MonsterInsights is ready to use on your website, the next thing to do is install and activate the eCommerce addon.
The addon automatically integrates with WooCommerce to track all of your sales and overall website performance.
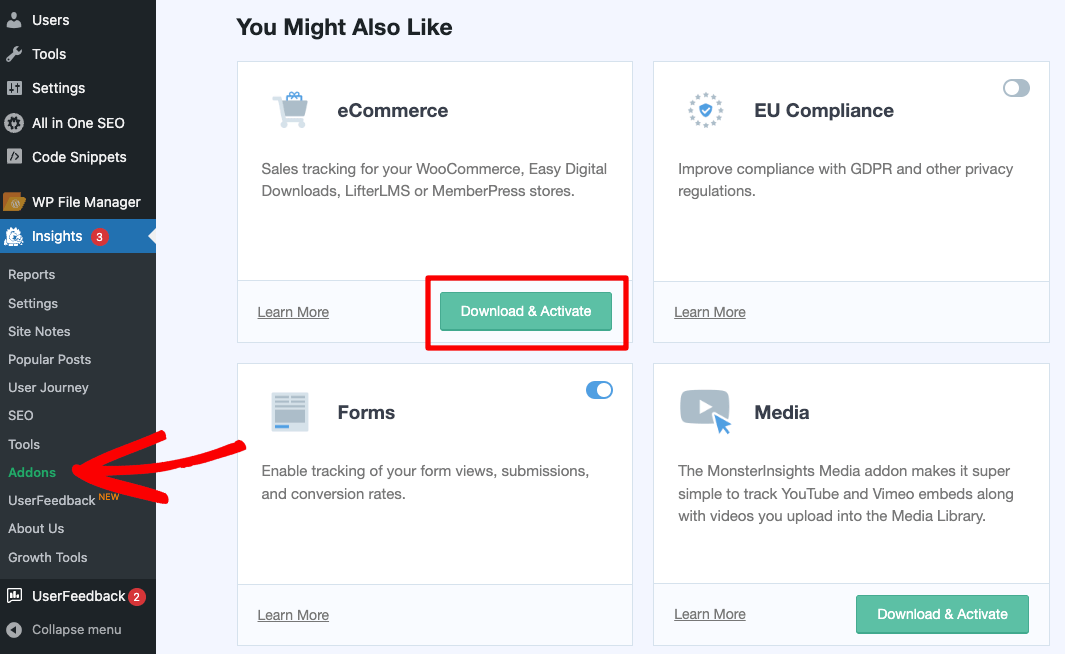
You can install the addon by going to Insights » Addons. In the eCommerce box, click Download & Activate.
That’s it! You’ve set up eCommerce analytics in a few simple clicks.
Step 3: Install the User Journey Addon (Optional)
If you’re using the eCommerce addon, we highly recommend installing the user journey addon also.
With the addon, you can easily see trends in shopping and user behavior, see at a glance how many sales you’ve made recently, which campaigns are driving the most sales, and more.
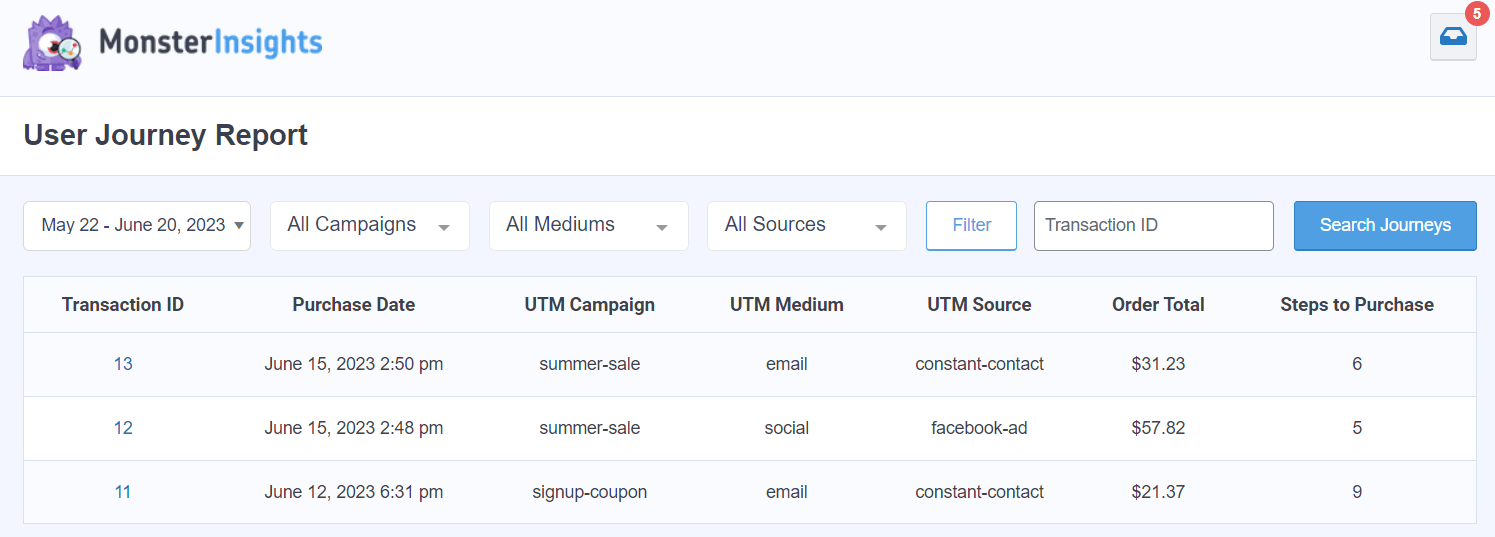
Plus, you can click into single user journeys to see the exact steps the user took:
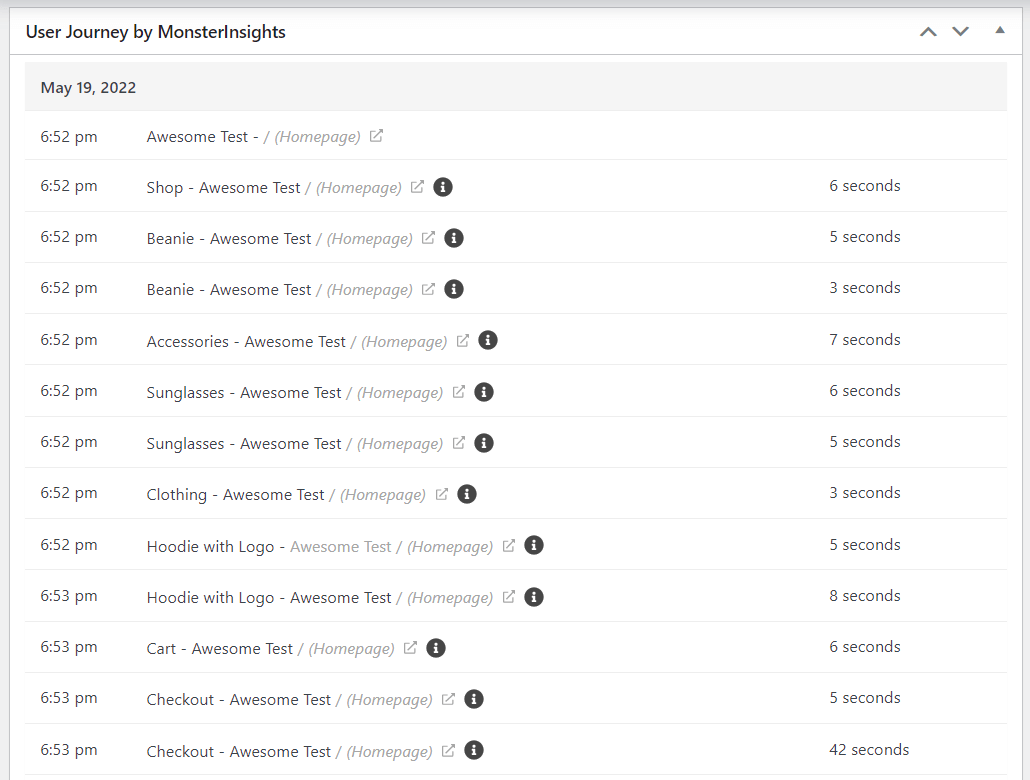
Find the addon by going to Insights » Addons in your WordPress dashboard and clicking Install.
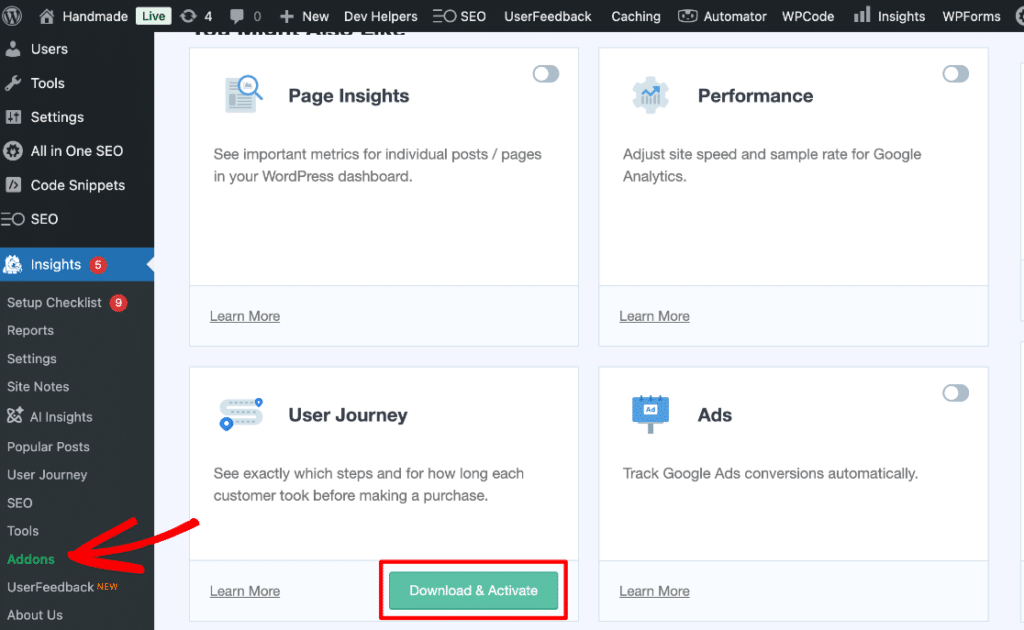
That’s it! You’ve enabled user journey reporting.
Make sure to check out the rest of the MonsterInsights addons while you’re there like our forms tracking addon, GDPR (EU compliance) addon, PPC Ads Tracking addon, and more. MonsterInsights has many tracking options!
Find Cart Abandonment Reports in WordPress
The best thing about using MonsterInsights is that you can see your major eCommerce stats, including cart abandonment rate, without leaving your WordPress dashboard.
MonsterInsights is the best WooCommerce analytics plugin because it brings some of the most important reports from Google Analytics and displays them on your website, so you don’t have to go anywhere. This is especially helpful if you’re a beginner and don’t know how to view different GA4 reports or find the data that matters.
To view stats about your online store, go to Insights » Reports » eCommerce » Overview.
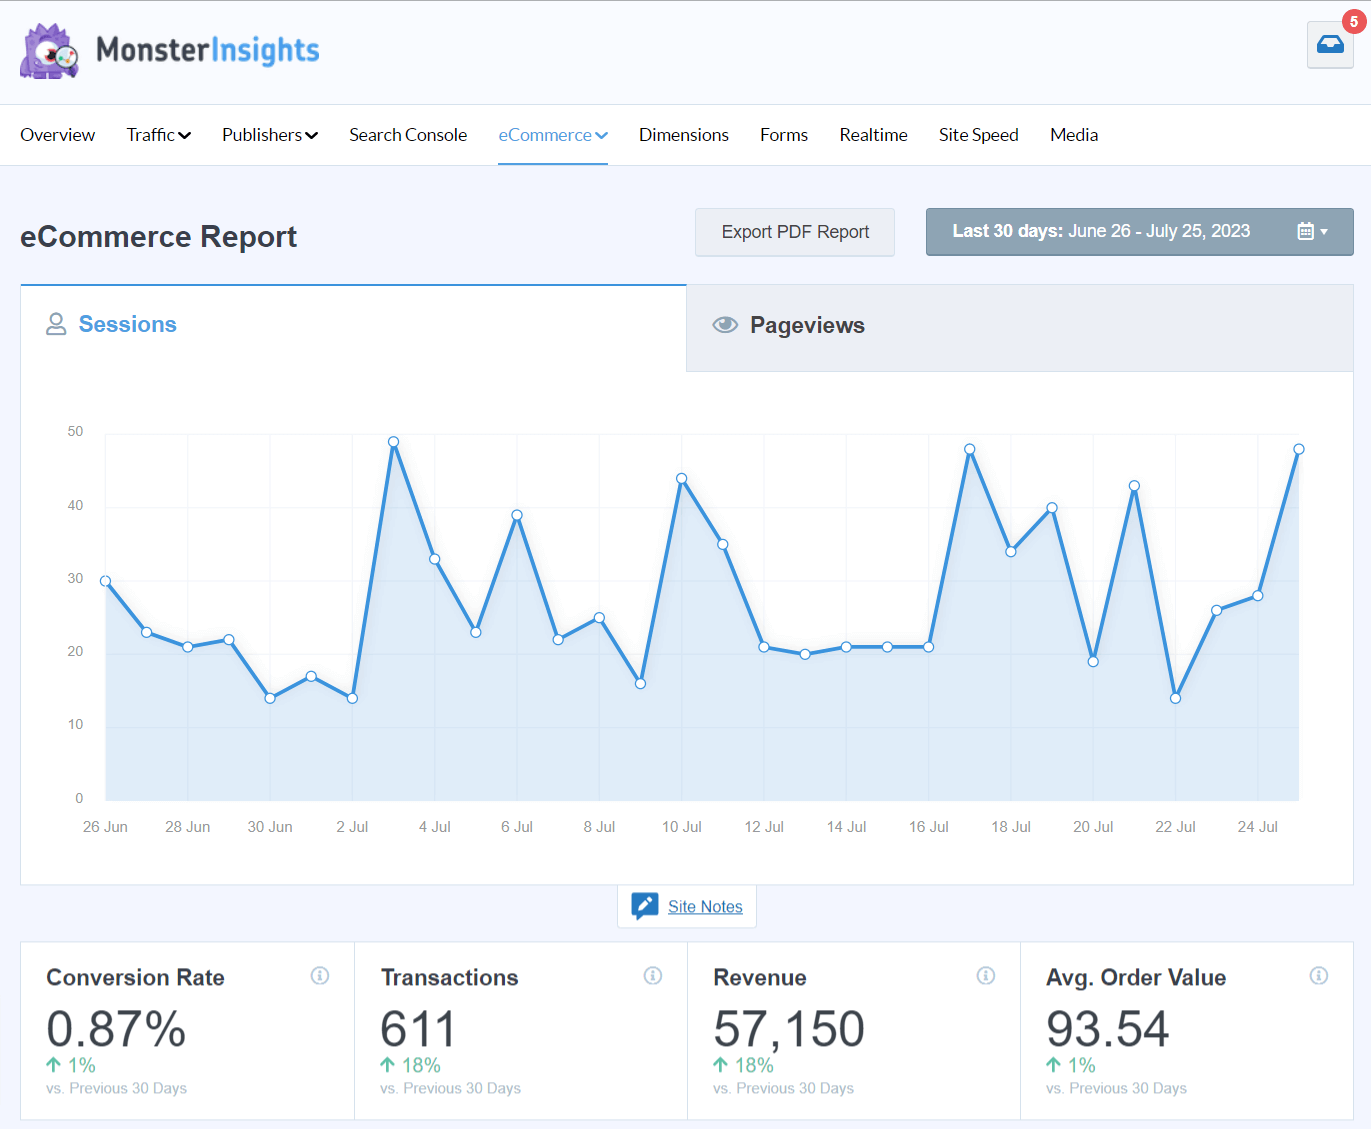
Your new Analytics dashboard shows you your site’s conversion rate, transactions, revenue, and average order value for the date range selected.
It can also show a comparison between the last time period (for instance vs. Previous 30 Days), so you know if your store’s performance improved.
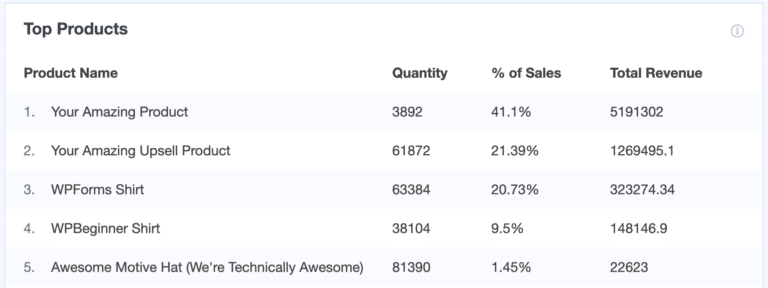
If you scroll down, the next report you’ll see is of Top Products. These are the best-selling items on your WooCommerce store. For each product, you can view its quantity sold, percentage of sales, and total revenue.
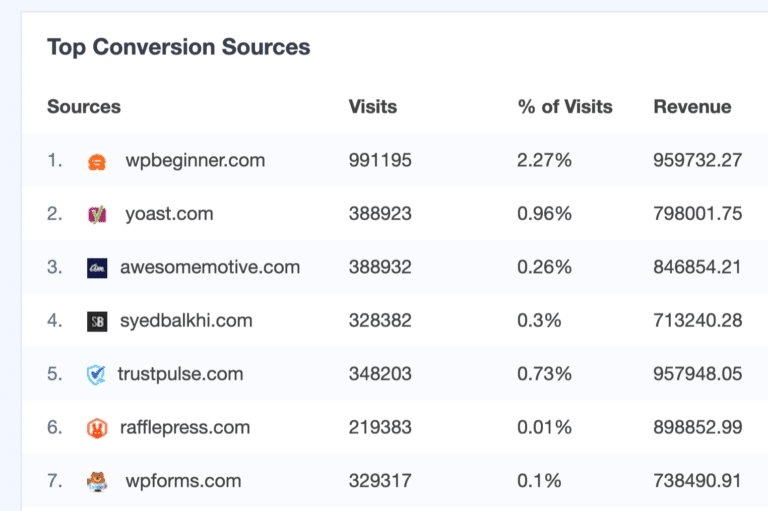
MonsterInsights also shows your Top Conversion Sources. These are websites that some of your buyers were referred from. You can see how many people came to your site from each source, their overall percentage of visits, and the revenue they generated.
The last reports you’ll see are of Total Add to Carts, Total Removed from Cart, New Customers, and Abandoned Checkouts. These eCommerce events help you understand your customers’ shopping and checkout behavior.

Next, check out the Funnel report under eCommerce » Funnel:
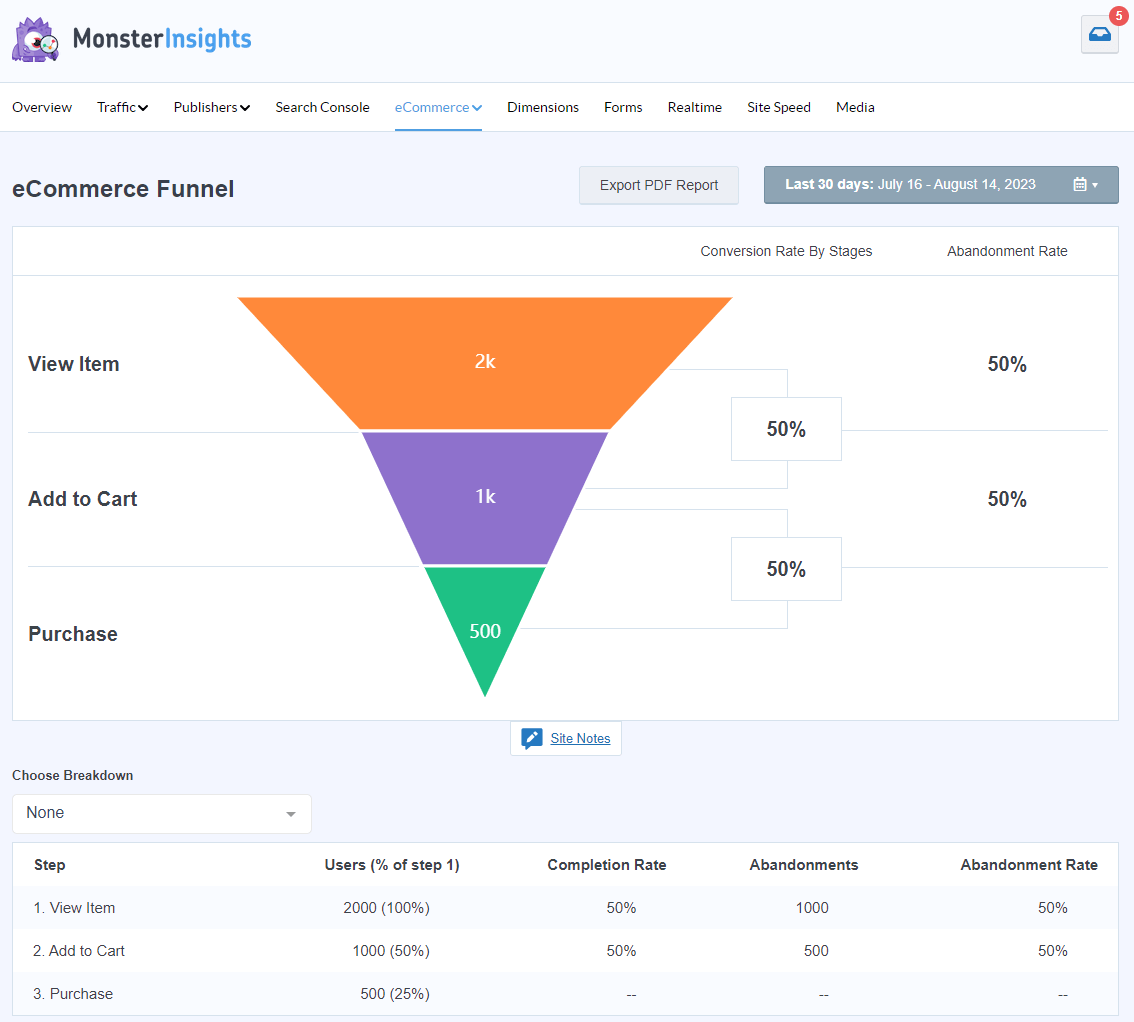
In this report, you can see the abandonment rate of your purchase funnel. How many users moved from viewing items to adding them to their carts to purchasing those items? If you’re seeing a ton of abandoned carts, that’s worth looking into.
You’ll also get a full Cart Abandonment report. This report has two tables: abandonment by product and abandonment by date. Use it to:
- See exactly which products are being abandoned (no more guessing!)
- Track abandoned quantities to spot inventory planning opportunities
- Monitor potential lost revenue for each product
- Identify peak abandonment times
- Monitor daily revenue impact
- Spot daily trends to optimize your marketing

Of course, you’ll also get all of the other reports in MonsterInsights that aren’t in the eCommerce tab, such as:
- Pageviews and landing page details
- Form tracking report
- Campaigns report
- Media report
- Source/medium
- Landing page details
- And much more
For a full tour of MonsterInsights dashboard reports, check out Your Ultimate Guide to MonsterInsights Dashboard Reports.
Create a Cart Abandonment Funnel in Google Analytics
In Google Analytics 4, select the Explore tab from the left sidebar. The Explorations screen opens. Now we’ll click on the + sign to create a new, blank exploration.
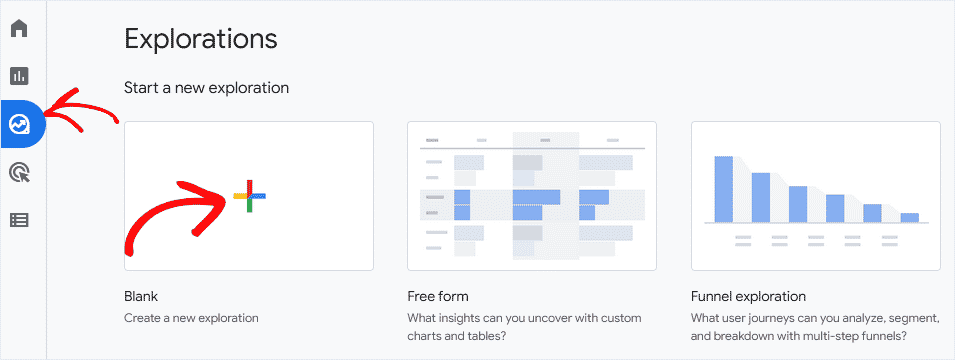
In the Explorations screen, type in a name for your custom exploration. Let’s call ours “Abandoned Carts.”
Then select Funnel exploration from the Technique drop-down list.
Next, you’ll create a list of steps that represent your checkout process. Click the pencil icon next to the Steps item.

Now, type in a name for your first step. We’ll call the first step of our funnel exploration “Add item to cart.”
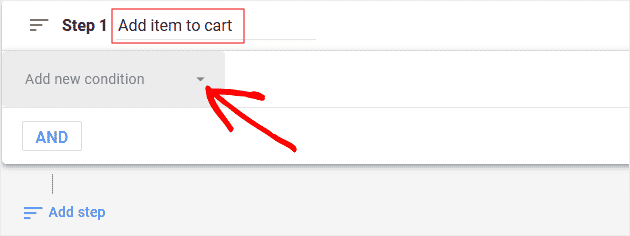
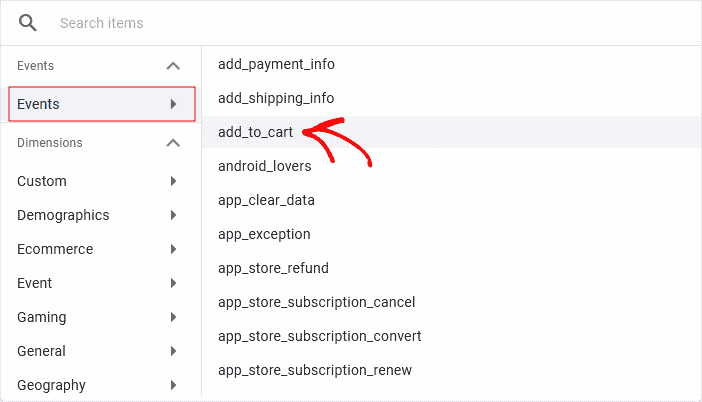
Click on Add new condition and choose Events » add_to_cart. This is going to show you the number of website visitors that added an item to their online shopping cart.
Add Steps to Track Cart Abandonment
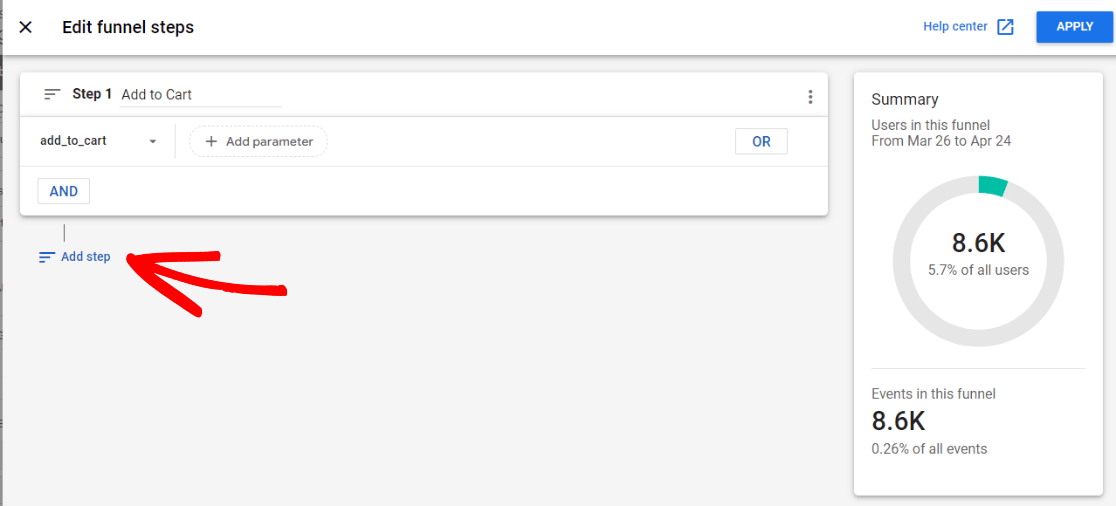
We need to add more steps to our funnel exploration at this point. Your checkout process might be a little different if it’s custom, but most will follow these same steps. Let’s add two more steps to our example.
All you need to do is repeat the process above for as many steps as you’d like to track. Buyers abandon carts at different stages of the checkout, so each step will give you a little more detailed information.
To add a step, click the Add step button below the Step 1 box.
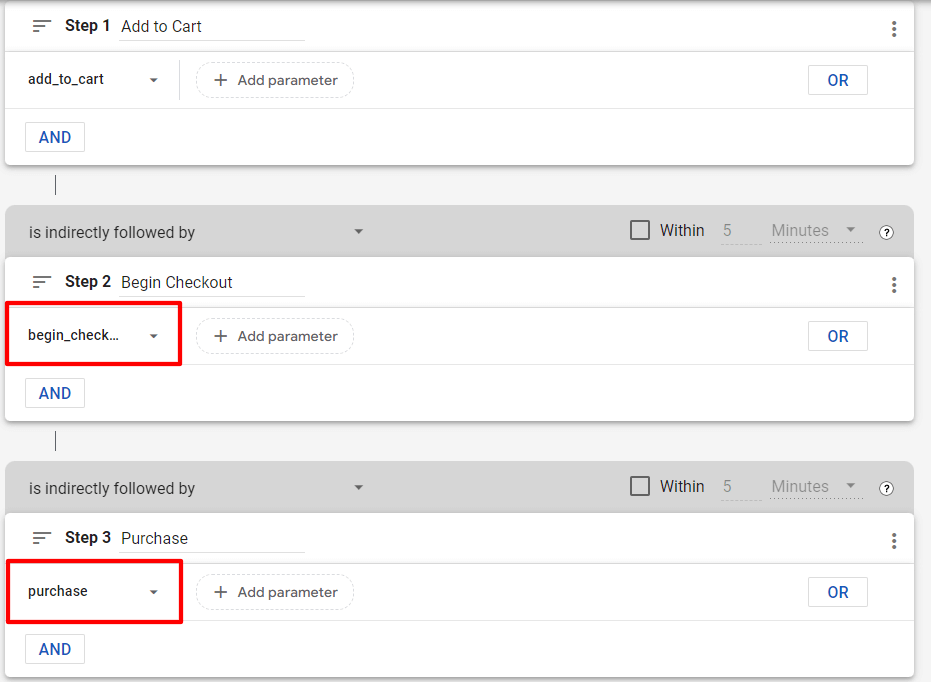
Now, we’ll name our steps and select the matching events like we did above.
In this case, we want to find out how many people added items to the cart, how many of those moved on to begin checkout, and finally how many actually completed a purchase.
So, we named the second step “Begin Checkout” and chose the event begin_checkout, and we named the third step “Purchase” and chose the event purchase:
We’re done with our funnel, so click the Apply button to see your cart abandonment data.
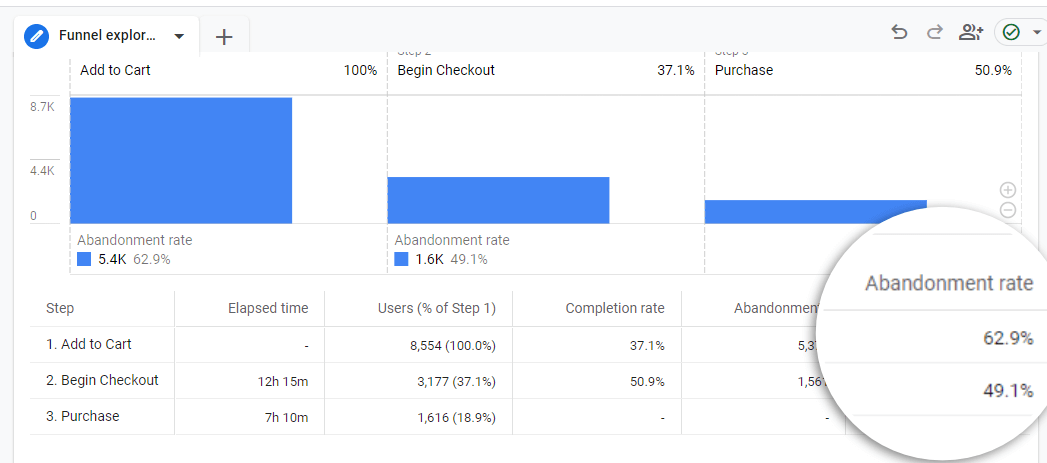
What does the table show? It shows each of your funnel steps and how many people entered that step. In the last column of the table, you can see the percentage of visitors who didn’t move on to complete the next step.
So in this case, 62.9% of people added items to their carts, then left the site before beginning checkout.
Of all the people who actually began checking out, 49.1% left and didn’t purchase their items.
As you can see, this is critical information. It might alert you to experiment with the checkout and payment process, considering 63% of potential customers are abandoning their carts at that point.
Steps to Reduce Your Cart Abandonment Rate
Now that you’re tracking cart abandonment, let’s look at some effective strategies to reduce it:
- Simplify the checkout process – Reduce the number of form fields and steps required to complete a purchase
- Offer multiple payment options – Including credit cards, PayPal, Apple Pay, and buy-now-pay-later services
- Be transparent about all costs – Show shipping, taxes, and fees early in the process
- Implement exit-intent popups – Offer a discount when someone is about to leave
- Send cart abandonment emails – Remind customers about items left in their cart
- Add a progress indicator – Show customers how far along they are in the checkout process
- Offer guest checkout – Don’t force account creation
- Display security badges – Build trust with security seals and HTTPS
For more detailed strategies, check out our guide on how to reduce shopping cart abandonment rate.
That’s it!
I hope you found this article on tracking shopping cart abandonment with Google Analytics helpful. You might also want to check out: how to set up WooCommerce conversion tracking.
WooCommerce Conversion Tracking: Complete Guide
eCommerce Digital Marketing Strategies, Tools, & Insights to Grow Your Store
9 Top eCommerce Metrics & KPIs to Track in Google Analytics 4
Not using MonsterInsights yet? What are you waiting for?
Finally, don’t forget to follow us on Facebook, and YouTube for more helpful reviews, tutorials, and Google Analytics tips.
Shopping Cart Abandonment Tracking FAQ
What is a good cart abandonment rate?
While the average cart abandonment rate across industries is around 70%, a “good” rate depends on your industry. Retail typically sees rates of 72-74%, while fashion is around 68-70%. Any rate lower than your industry average could be considered good, but always aim to improve your numbers.
How do I calculate cart abandonment rate?
The cart abandonment rate formula is: (Number of abandoned carts ÷ Number of initiated carts) × 100. In Google Analytics, this is calculated as the percentage of users who added items to cart but didn’t complete a purchase.
How can I track abandoned carts in Google Analytics 4?
You can track abandoned carts in GA4 by creating a funnel exploration that includes steps like “add to cart,” “begin checkout,” and “purchase.” The drop-off between these steps represents your cart abandonment.
Why is my cart abandonment rate so high?
Common reasons for high cart abandonment include unexpected shipping costs, complicated checkout processes, website errors, lack of payment options, security concerns, and forced account creation. Analyzing where users drop off in your GA4 funnel can help identify specific issues.
What’s the difference between cart abandonment and checkout abandonment?
Cart abandonment happens when users add items to their cart but leave before starting the checkout process. Checkout abandonment occurs when users begin the checkout process but don’t complete their purchase. Both metrics are important, but they point to different issues in your sales funnel.
