Do you want to know the average value of each eCommerce transaction in your online store? You can easily find out by finding your Average Order Value in Google Analytics.
But if you’ve never used Google Analytics before or don’t know how to navigate it, then it can be tricky to set up eCommerce tracking and navigate through the reports to find the data you need.
So, in this article, we’ll show you how to find your average eCommerce order value in Google Analytics.
Average Order Value Video Walkthrough
What is Average Order Value?
Average Order Value (AOV) is a metric that tells you the average value of an eCommerce transaction in your online store. In other words, it tells you, on average, how much revenue each order brings in.
It’s calculated like this:
Average Order Value = Product Revenue / Total Transactions
Why is Calculating Average Order Value (AOV) Important?
Just like conversion rate, your average order value is an important eCommerce key performance indicator (KPI) that’s vital to your online business.
Your average order value is directly tied to your revenue. If you increase your AOV, you’ll likely increase your overall revenue.
To increase your average order value, you can try tactics like:
- Recommend popular or related products
- Upsell at checkout
- Set a minimum for free shipping
How to Find Your eCommerce Average Order Value
You can find the average order value of your WordPress store in the following places:
- Inside Your WordPress Dashboard (With MonsterInsights)
- In Your Google Analytics Account
Of the 2 methods, it’s far more convenient to view your report inside your WordPress dashboard. You don’t need to navigate away from your site or log into another website to view your reports.
Now, let’s look at each method in detail.
How to View Average Order Value in WordPress
MonsterInsights makes it super simple to view your online store’s average order value inside your WordPress dashboard. It’s the best Google Analytics plugin for WordPress, as you can set up advanced tracking (including eCommerce tracking) without having to edit any code.
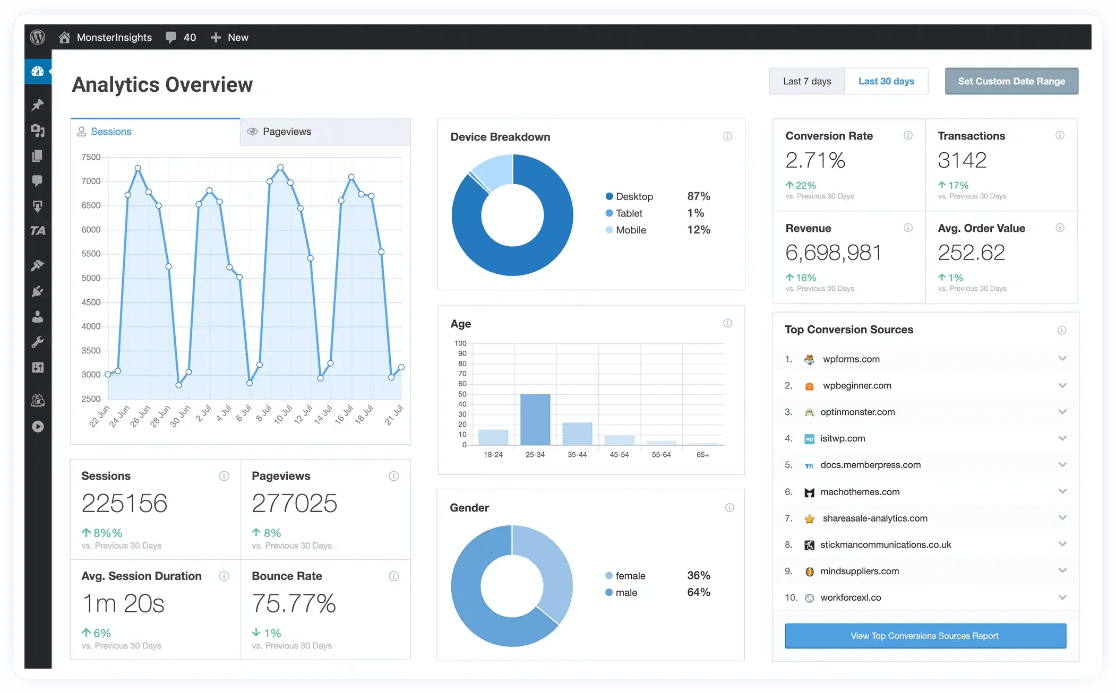
MonsterInsights makes it very easy to install and use Google Analytics on your WordPress site. Even an absolute beginner can easily set up Google Analytics and track their important website metrics.
Best of all, it allows you to see all of your website reports right inside your WordPress dashboard.
If you want to know more about how MonsterInsights makes Google Analytics simple, read our detailed post on MonsterInsights vs. Google Analytics.
To view your eCommerce website’s performance along with the average order value, let’s get started with setting up eCommerce tracking in Google Analytics.
Step 1 – Install MonsterInsights and the eCommerce Addon
To get started with MonsterInsights eCommerce tracking, you’ll need the Pro license.
For a full tutorial on installing and setting up MonsterInsights at the Pro level, check out How to Add Google Analytics to WordPress the Right Way (2023).
After you have MonsterInsights installed, open your WordPress dashboard and navigate to Insights » Addons. Then, install the MonsterInsights eCommerce addon.
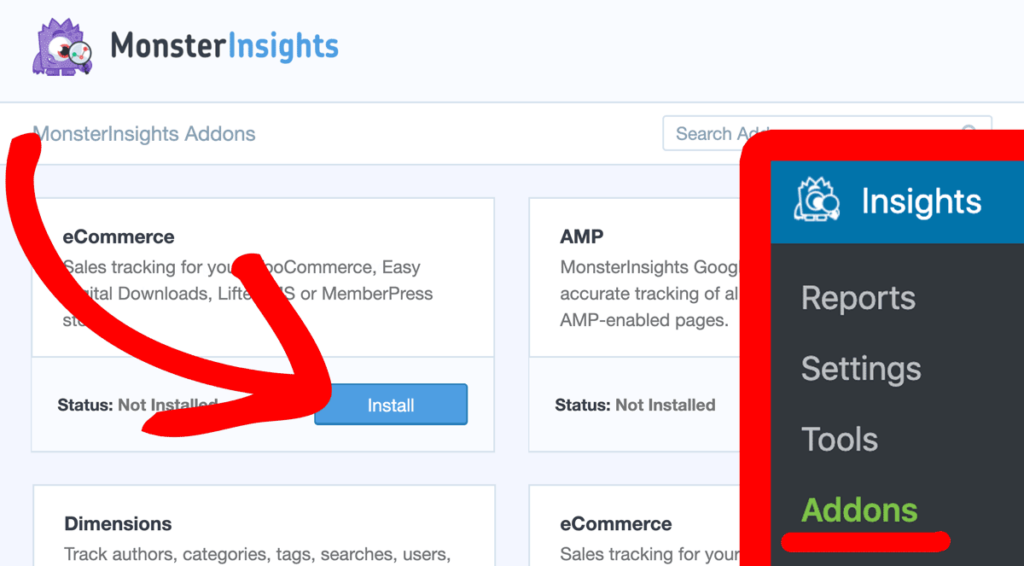
After a few seconds, the addon will activate and will be ready for use.
That’s it!
Now, Google Analytics will start gathering data on your eCommerce sales.
Step 2 – View Your Average eCommerce Order Value in Your Dashboard
Once you’ve completed setting up your eCommerce tracking, you can check your reports after a few hours have passed. Google Analytics usually takes 24-48 hours to gather the complete data you’ll need.
With MonsterInsights, it’s really easy to view your eCommerce reports because it allows you to see the most important data directly inside your WordPress dashboard.
To view your eCommerce reports, go to Insights » Reports from your dashboard and click the eCommerce tab at the top.
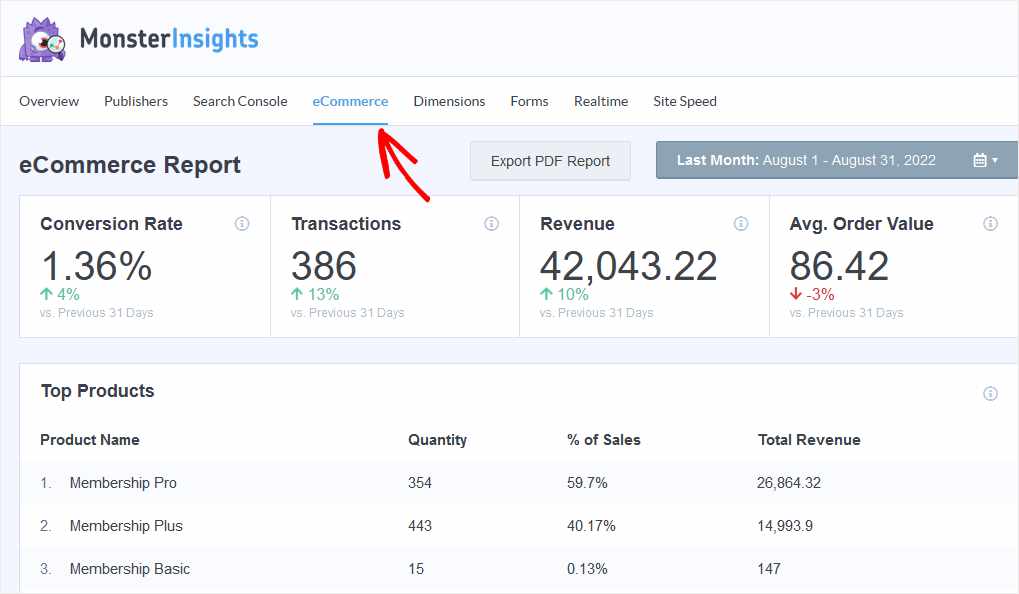
In your eCommerce report, you’ll see your eCommerce store’s average order value along with your conversion rate, total transactions, top products, and more.
Next, we’ll show you how to see that same report in Google Analytics.
Find Your Average Order Value in Google Analytics
To start, head to the Explorations tab and create a Blank report:
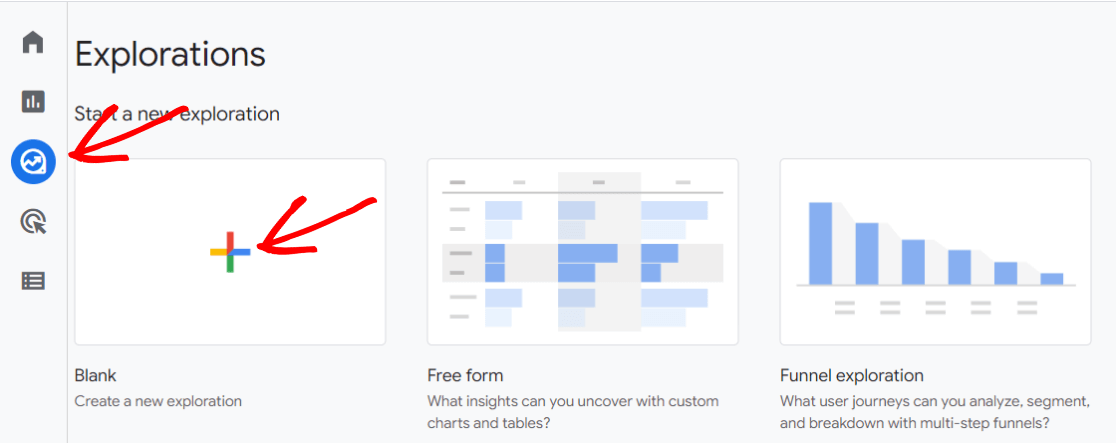
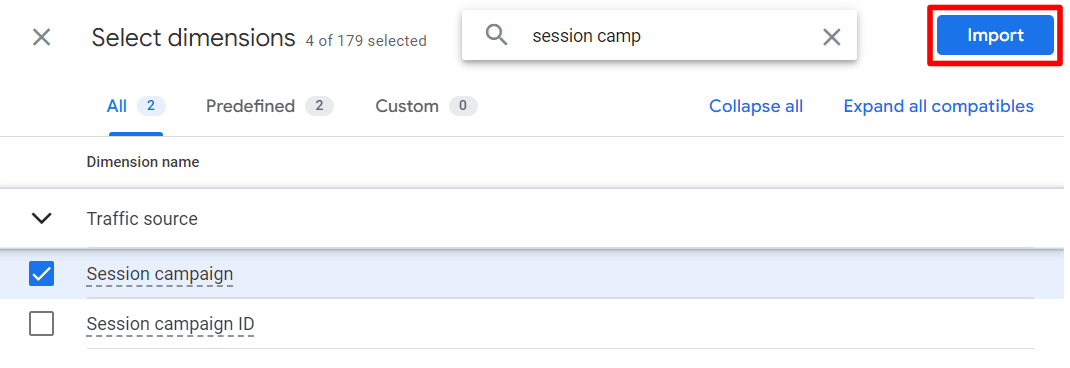
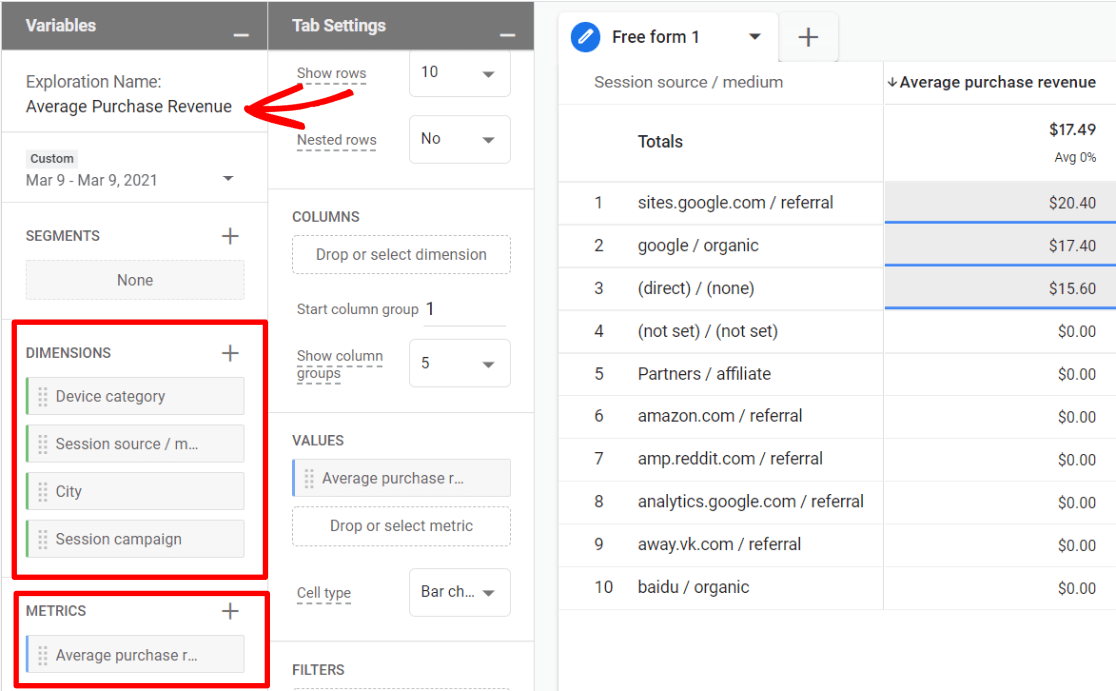
Now, you can name your report something like Average Purchase Revenue. Then, click the plus icon next to Dimensions and import the following dimensions:
- Device category
- Session source/medium
- City
- Session campaign
To help you find each dimension, use the search bar:
Click the plus icon next to Metrics and import the Average purchase revenue metric to your report:
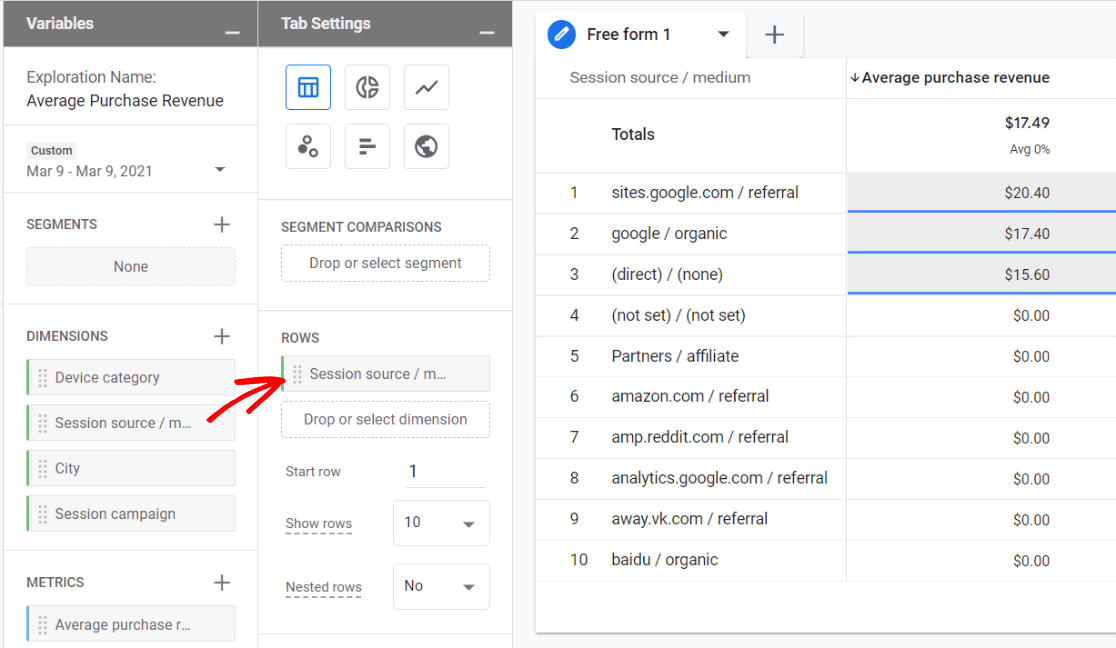
Now, choose a Dimension to start with and click and drag it over to the Rows section. Here’s what your report will look like if you use Session source/medium:
Then, click and drag Average purchase revenue from your Metrics over to the Values spot:
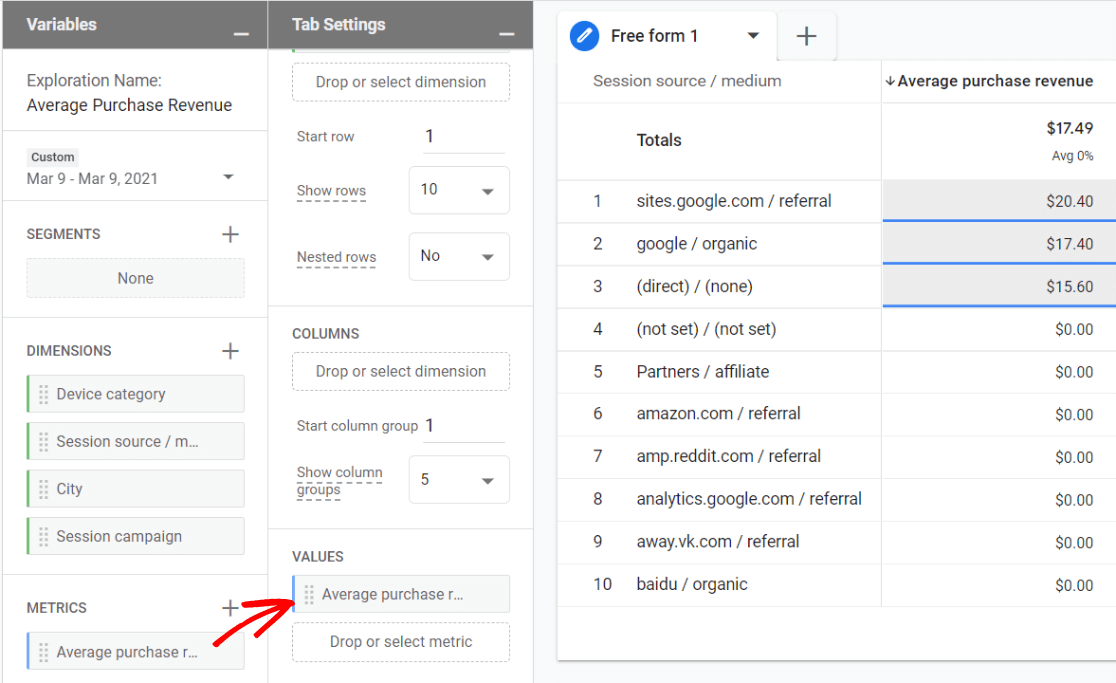
You now have a report of your average order value by session source/medium. Experiment by adding the other dimensions to the Rows box that we added to the report instead of session source/medium.
That’s it!
We hope this guide helped you to find the average order value of your eCommerce store.
If you’re looking to boost sales and revenue from your store, you’ll enjoy reading this guide on eCommerce customer retention strategies. You should also check out Top eCommerce Metrics & KPIs to Track in Google Analytics 4.
Not using MonsterInsights yet? What are you waiting for?
And don’t forget to follow us on Twitter, Facebook and YouTube for more helpful Google Analytics tips and tutorials.

How to display particular product name in the dimension?
Hey there – average order value can’t be applied to products, since it’s a user-based metric. If you tell us more about what exactly you’re trying to see or figure out, we might be able to help more 🙂