Want to learn how to connect Google Analytics to Meta (Facebook) and track website traffic from Facebook?
When you set up Google Analytics Facebook tracking, you can see how many users come to your website from Facebook, how much time they spend there, what pages they visit, and more.
Plus, if you run Meta (Facebook) Ads, you can track conversions from your ads to see if they’re worth the cost.
All of this data is crucial to optimizing your site for more traffic and conversions from Facebook and beyond.
In this article, I’ll show you how to easily track website traffic and ad conversions from Facebook in Google Analytics. I’ll also take a look at all the different ways you can connect Facebook, your website, and Google Analytics.
Google Analytics + Facebook Video Tutorial
What happens when you connect Google Analytics to Meta/Facebook?
You want to track website traffic from Facebook in Google Analytics to see what’s happening once people land on your website from Facebook. This is in addition to viewing Facebook Insights to see what people are doing while on your Facebook page.
With over 2.09 billion daily active users, Facebook is an ideal place to reach a wide audience base that is sure to be interested in what you have to offer. However, since Facebook shifted to focus more on family and friends, businesses have found that reaching their target audience on Facebook is harder than ever.
As a result, tracking user behavior becomes even more important if you want to capitalize on Facebook’s reach potential.
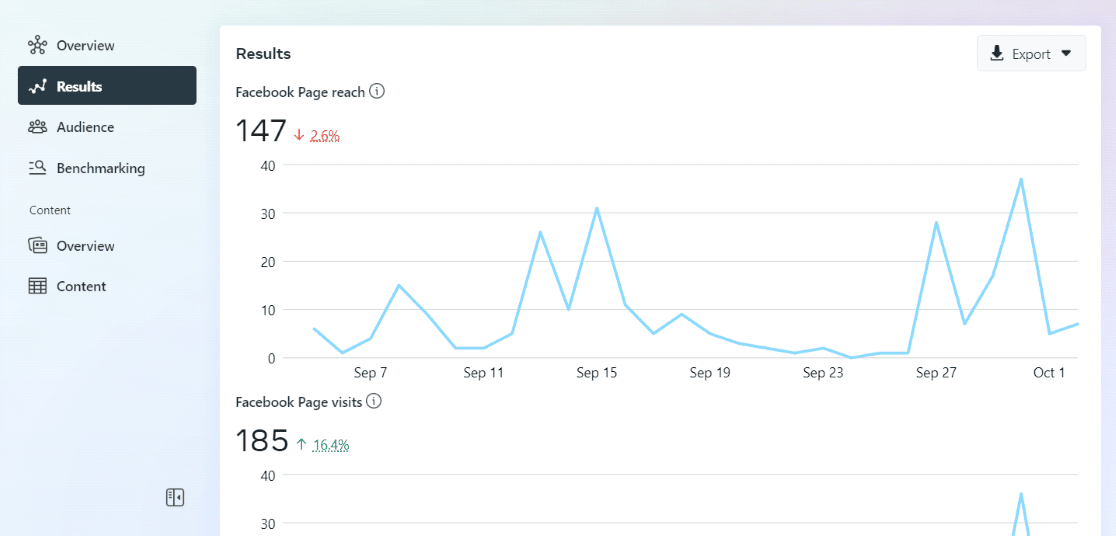
Facebook Insights focuses on activity that happens on your Facebook page (and your Instagram profile if you have one):
- Reach
- Page likes
- Demographics of your followers
- Interactions
But what about what happens after a Facebook user clicks on a link and lands on your website?
Without knowing what your Facebook audience is doing once they visit your website, you can’t possibly know whether your content marketing efforts are working.
That’s why you must connect Google Analytics to Facebook and track website traffic from Facebook.
How to Connect Google Analytics to Facebook
First, if you don’t have Google Analytics yet, you’ll need to get that set up. If you need help, follow this tutorial.
Is your site on WordPress? The easiest way to connect Facebook, WordPress, and Google Analytics is with MonsterInsights.
MonsterInsights is the best Google Analytics plugin for WordPress. It allows you to easily connect your WordPress site with Google Analytics (and Facebook) to view all the data that matters most right inside your WordPress dashboard.
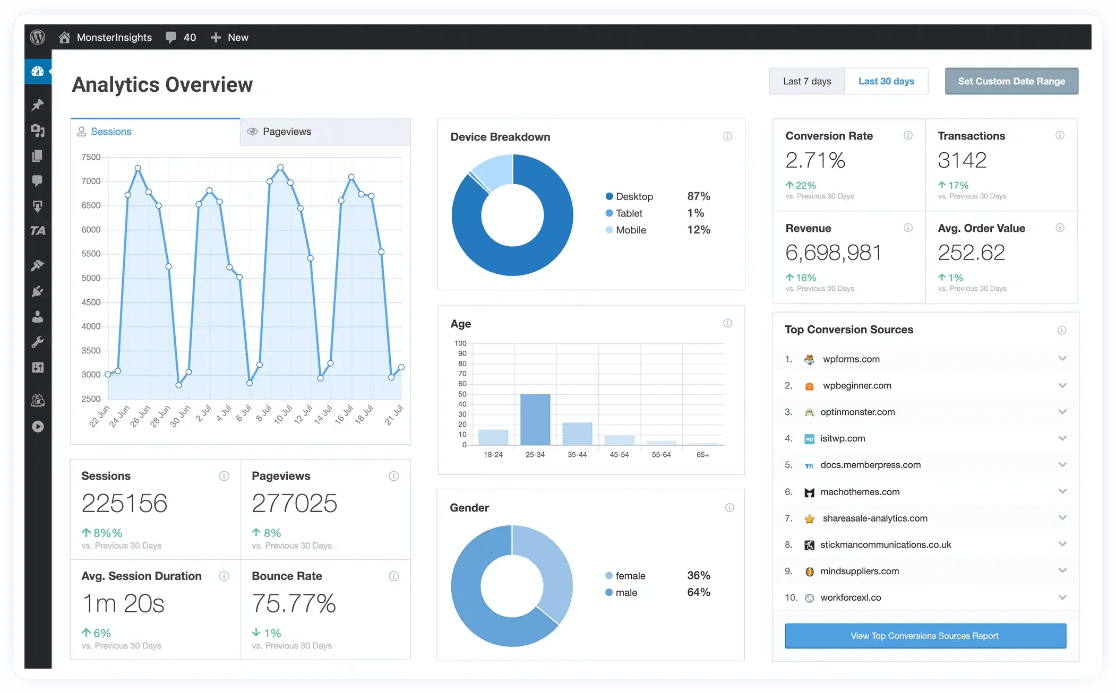
Plus, with a couple of clicks, you can set up extra tracking features that don’t come out of the box with Google Analytics, such as event tracking, eCommerce tracking, form tracking, custom dimension tracking, outbound link tracking, and more.
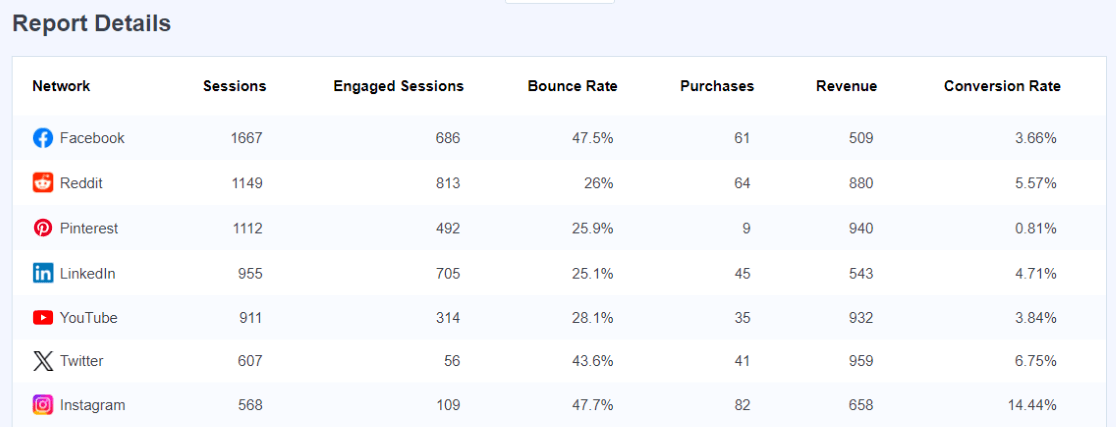
Using MonsterInsights Plus or above, you’ll see your Facebook traffic directly inside your WordPress dashboard:
Plus, you’ll be able to install your Facebook (Meta) pixel without touching any code:

Get started with MonsterInsights now!
Once you have Google Analytics set up, you’re ready to go. There’s no other special thing you need to do to connect Google Analytics to Facebook—Google Analytics will track all your Facebook traffic automatically (unless you need to track Facebook Ads).
However, there are still a few things you’ll need to know:
- How to find your Facebook traffic reports in Google Analytics
- A really neat way to categorize your Facebook traffic and keep track of specific campaigns
I’ll start by looking at how to find and report on your organic Facebook traffic in Google Analytics. Looking for how to track conversions from your Meta ads? Meta started rolling out a special connection with GA4 in June of 2024. For more on tracking Meta Ads, check out How to Track Facebook Ads in Google Analytics (the Easy Way).
How to Track Website Traffic From Facebook
Google Analytics automatically tracks your Facebook traffic, but where can you find it in your reports?
1. Find Facebook Traffic in Google Analytics
Let’s take a look at which Google Analytics reports you’ll look at to track website traffic from Facebook.
Traffic Acquisition Report
The quickest way to track your website traffic from Facebook is with the traffic acquisition report.
In Google Analytics, find the report by navigating to Reports » Acquisition » Traffic acquisition:
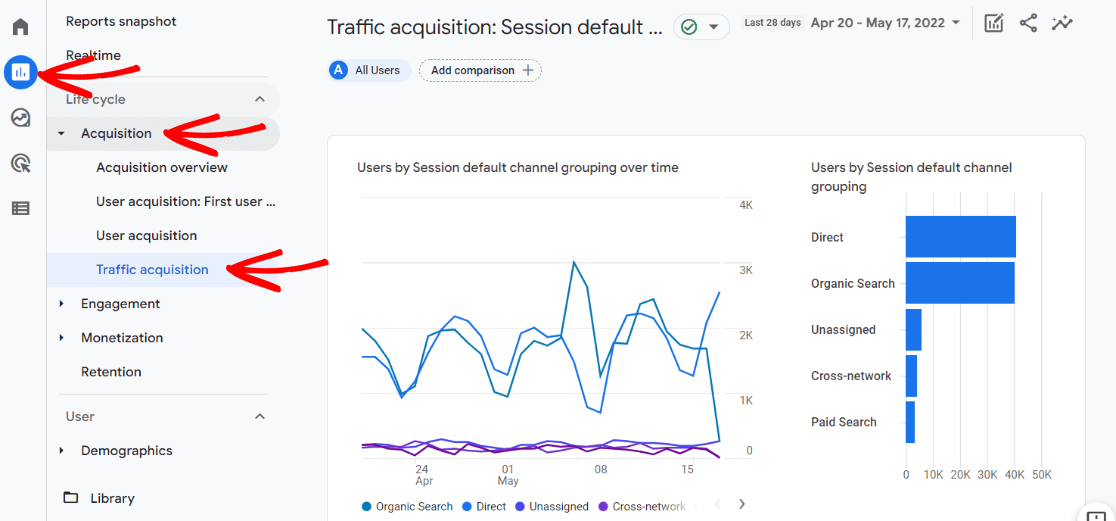
Then, scroll down to the table. You’ll see one channel called Organic Social – this is where traffic from social media, including Facebook, will be grouped.
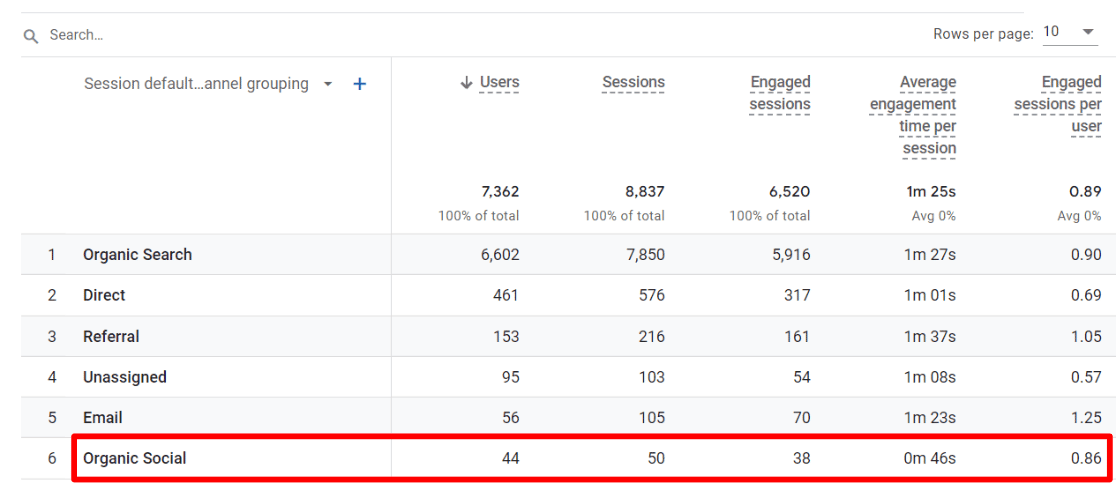
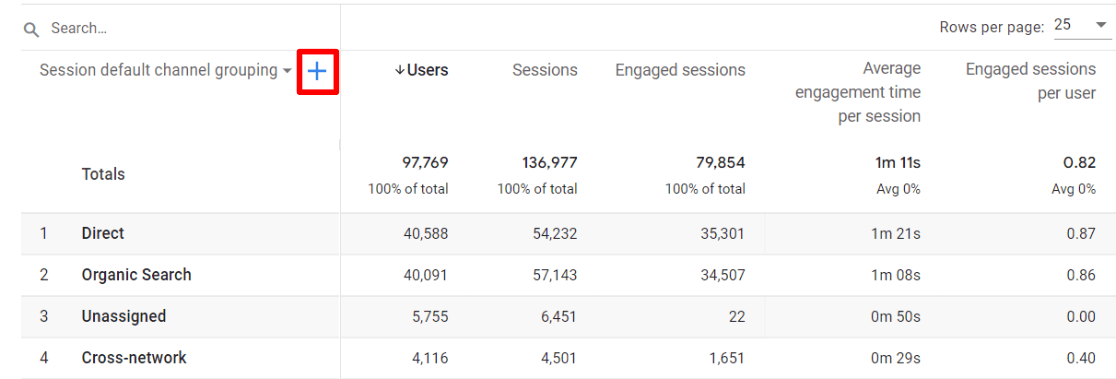
To drill down to just your Facebook traffic, click the blue plus sign to add a secondary dimension to your table:
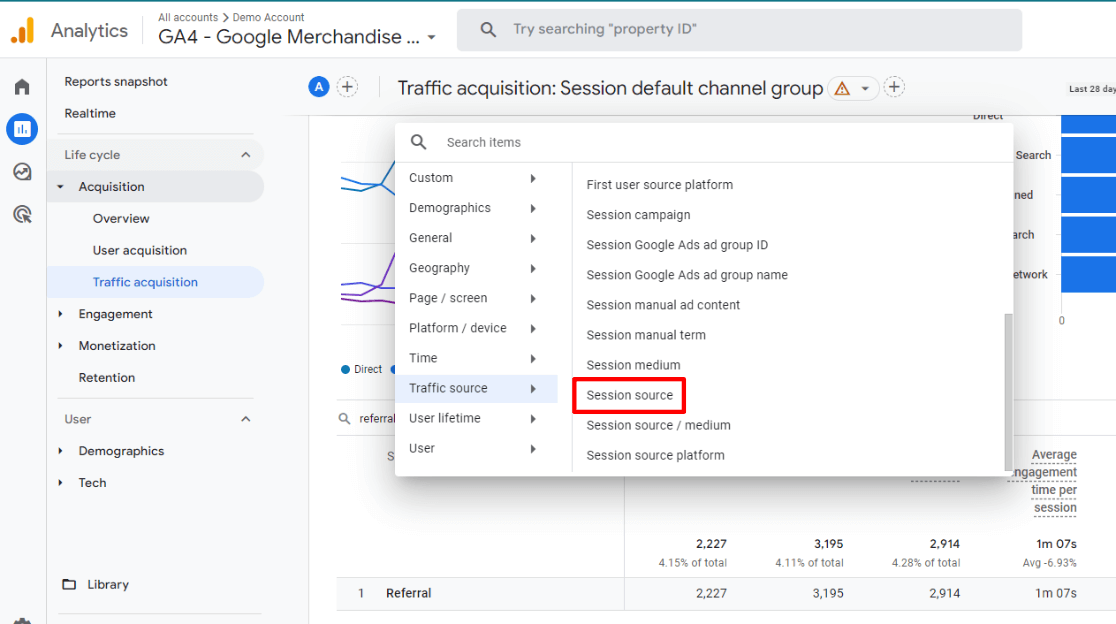
Then, navigate to Traffic Source and choose Session source:
Now, locate the Search bar and type in “facebook“:
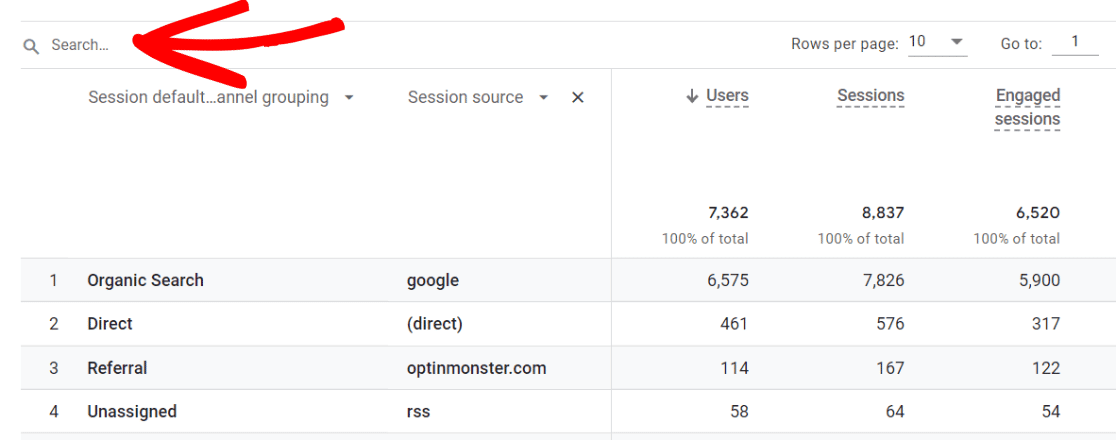
Now, you’ll have a report that includes just your Facebook traffic. Scroll to the right to find more metrics like average engagement time per session, engagement rate, key events (formerly conversions), and revenue.

Using WordPress? Quickly and easily find your Facebook traffic right inside your WordPress dashboard with MonsterInsights:

Google Analytics Custom Report
Creating a custom exploration report in Google Analytics 4 is intimidating at first, but follow my step-by-step tutorial below, and you’ll have a really helpful, in-depth Facebook traffic report that you’ll refer to all the time. You only have to create it once!
Let’s dive in.
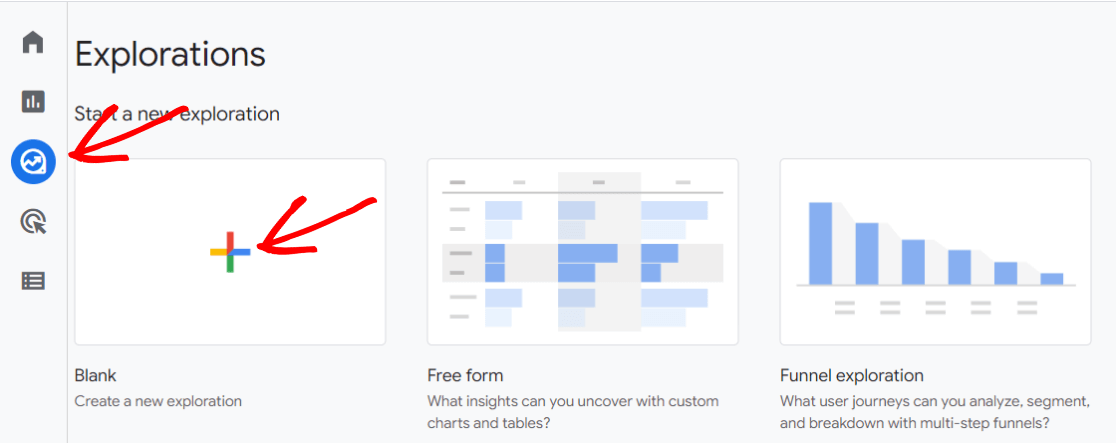
First, open GA4 and navigate to the Explore tab. Click to create a Blank report:
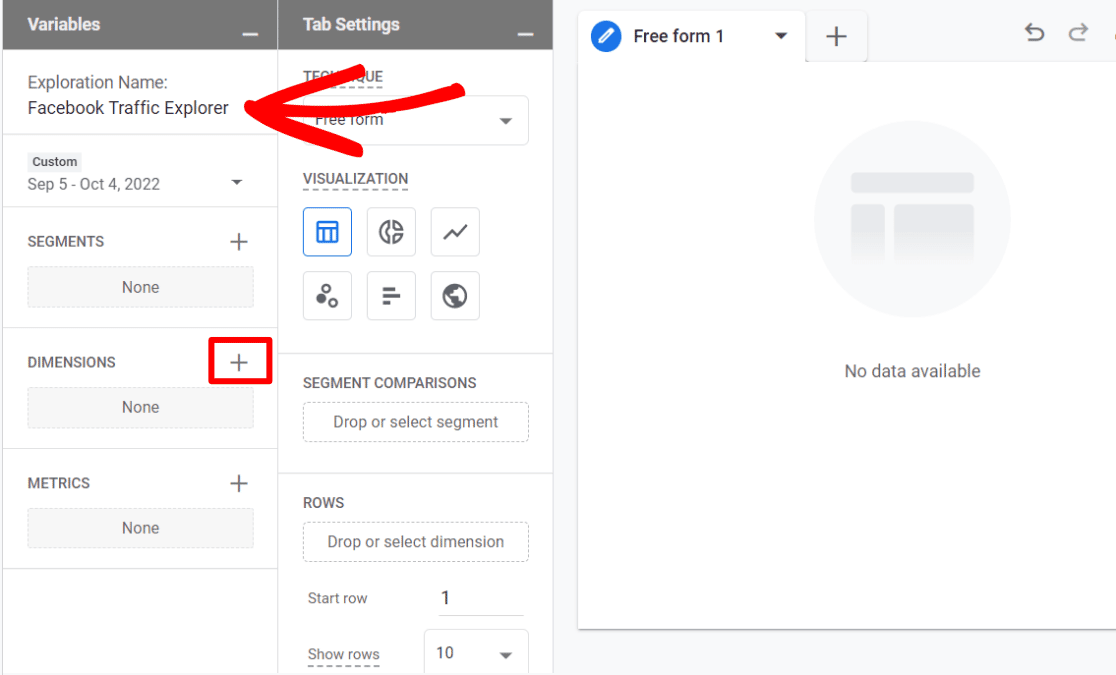
Now, name your report something meaningful, then click the plus sign in the Dimensions area:
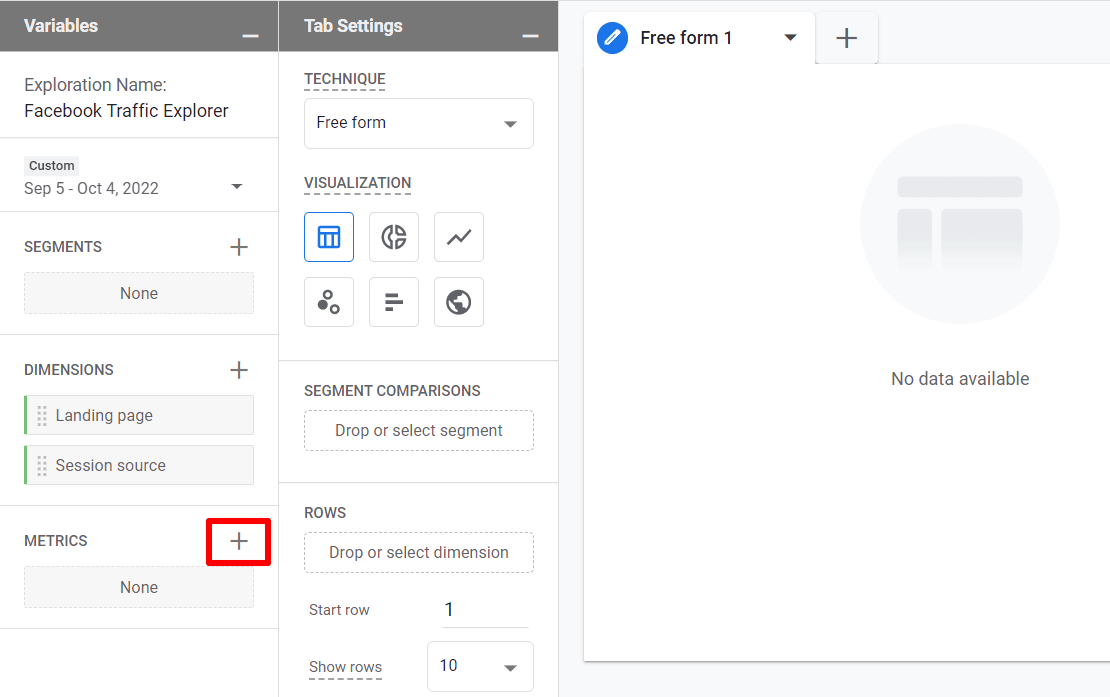
On the selection screen that comes up, search for, select and import the Session source and Landing page dimensions:

Now, click the plus sign in the Metrics area:
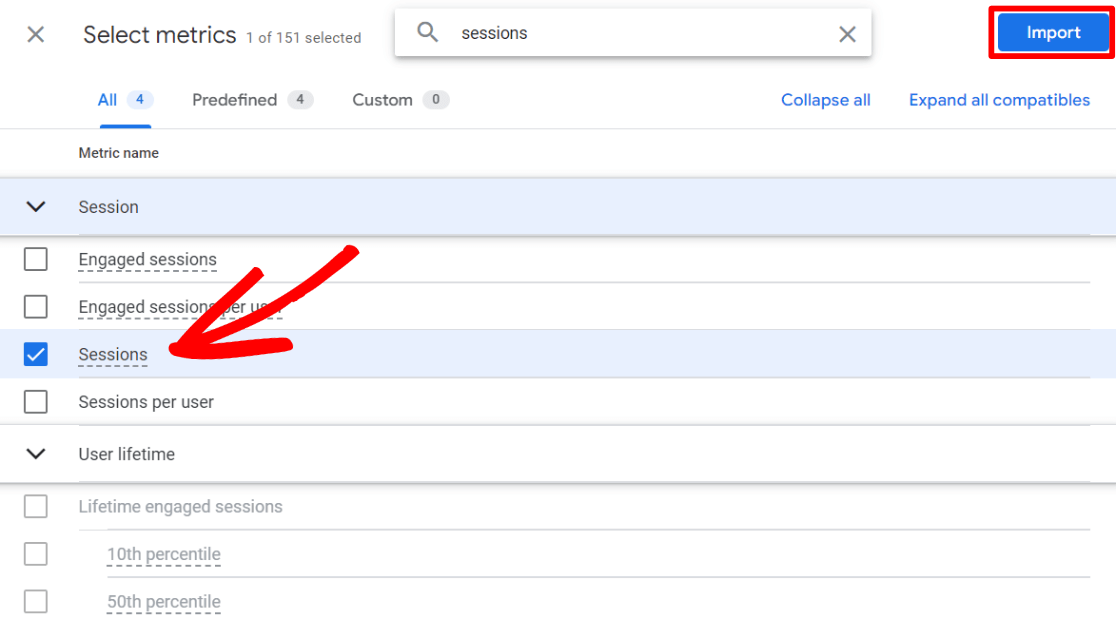
Search for, select and import all of the following metrics:
- Sessions
- Engaged sessions
- Engagement rate
- Average engagement time per session
- Key events (formerly conversions)
- Revenue (optional – for eCommerce stores)
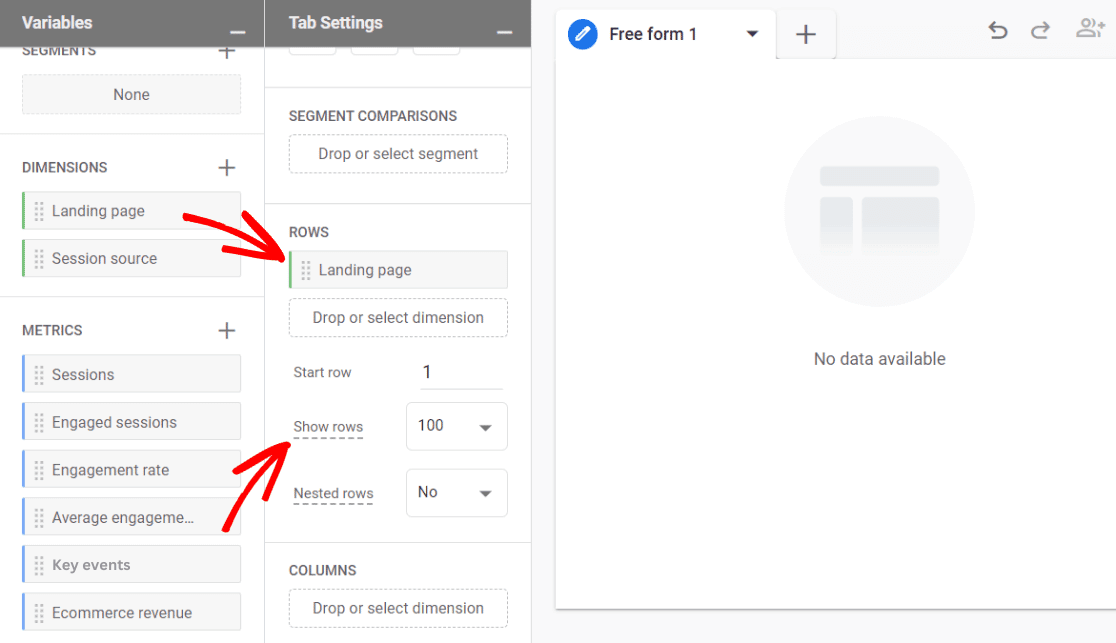
Next, click and drag the Landing page metric over into the Rows box. At this step, you can also use the Show rows dropdown to make your report show you more than the top 10 results:
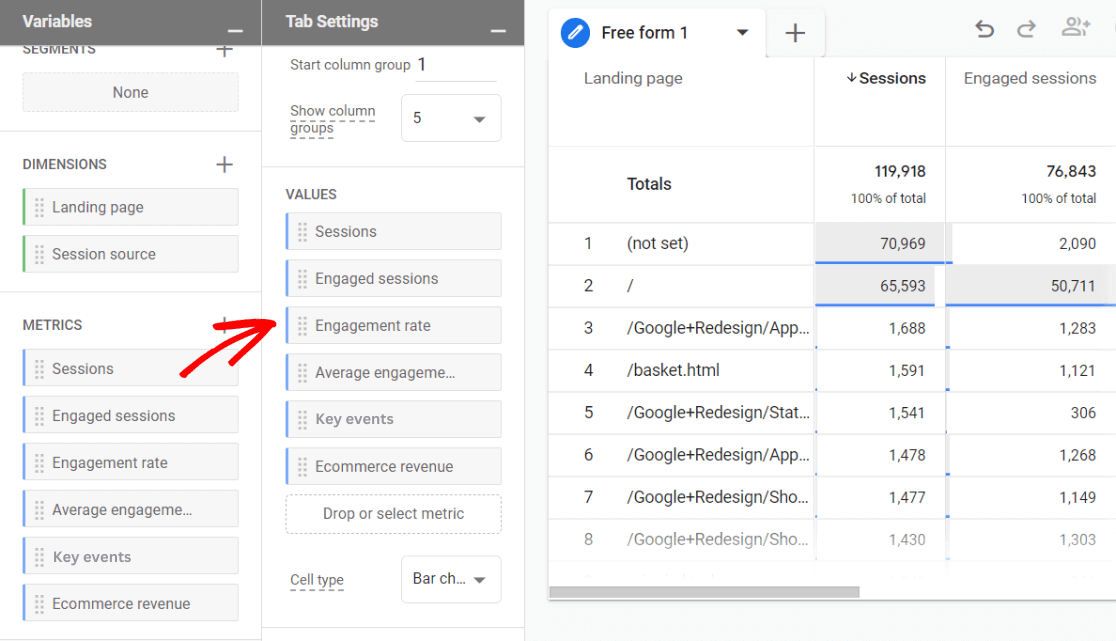
Then, click and drag all of your Metrics over into the Values box:
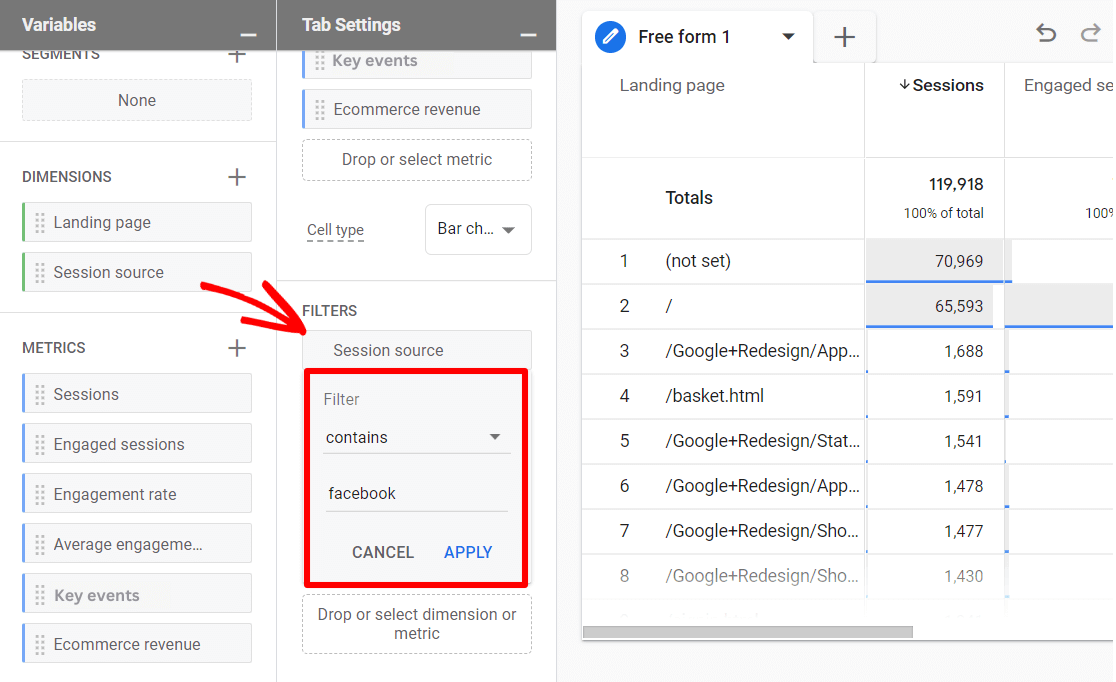
Finally, click and drag Session source down into the Filters box. In the dropdown, choose contains and type in facebook, then click Apply:
That’s it! You now have a pretty comprehensive report about your Facebook traffic.
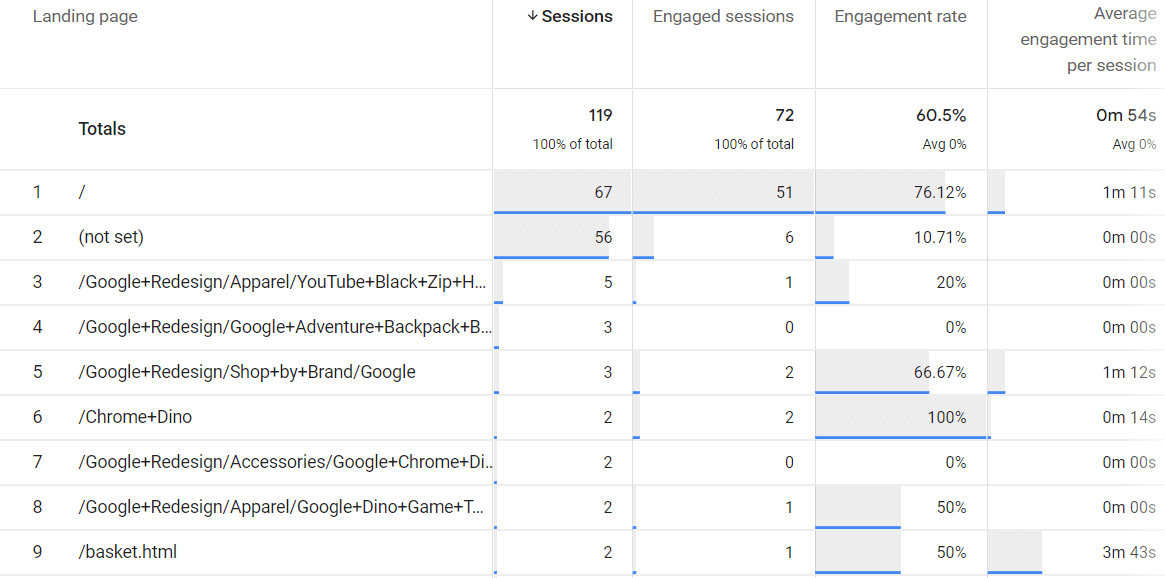
Since the report is totally customizable, you could add anything to it that makes sense for your website. Maybe you’re hoping your visitors from Facebook fill out your forms. In that case, you could add Event as a metric, put it in the Values box, and also drag it into Filters to choose the form event.
2. Use Campaigns
Campaigns are a way to categorize your traffic in Google Analytics in a really cool, helpful way.
To use campaigns, you’ll create a link with some extra code bits (called UTM parameters) to share in your posts. Those links look something like this:
http://www.yoursite.com/cool-blog-post/?utm_source=facebook&utm_medium=infographic_share&utm_campaign=q4_2022
Then, you can run reports in Google Analytics that include those bits of code (parameters) to categorize your traffic.
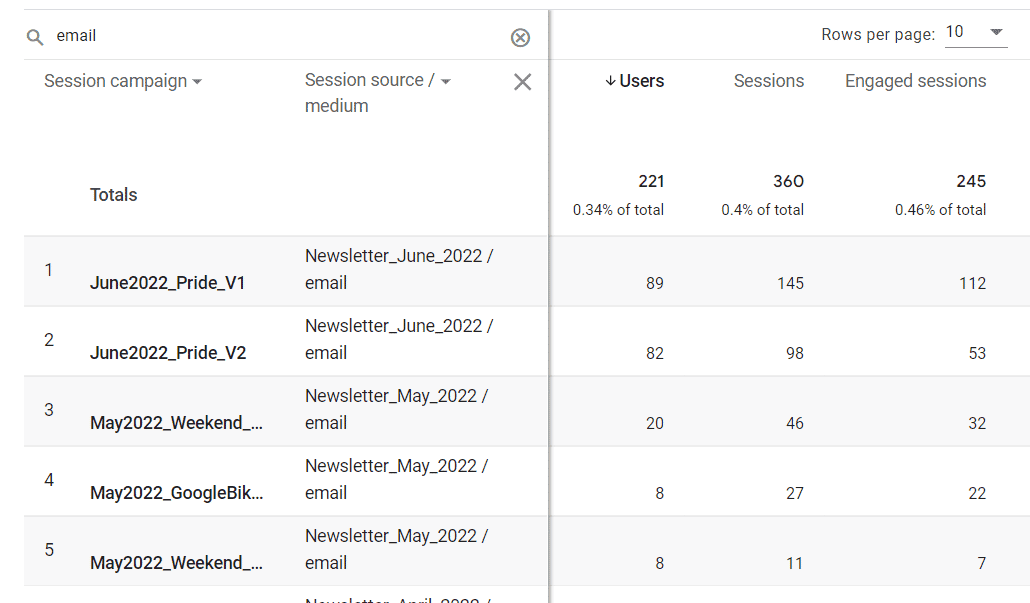
For more on using campaigns, check out A Beginners Guide to UTM Parameters (And How to Use Them).
That’s it! I hope you learned all about how to track Facebook traffic with Google Analytics.
If you liked this post, we think you might also like A Complete Guide to GA4 Conversion Tracking for WordPress.
Not using MonsterInsights yet? What are you waiting for?
And don’t forget to follow us on Facebook and YouTube for more helpful reviews, tutorials, and Google Analytics tips.
Facebook (Meta) and Google Analytics FAQ
How do I track Facebook traffic in Google Analytics 4?
Google Analytics will automatically track traffic from Facebook, but you can enhance it with UTM parameters. Track Facebook traffic in Google Analytics 4 by using UTM parameters in your Facebook ad and post links. In GA4, navigate to Reports » Acquisition » Traffic Acquisition, then filter by Campaign and search for the campaigns you used in your UTMs.
Can I track Facebook Ads conversions in Google Analytics?
Track Facebook Ads conversions in Google Analytics by setting up UTM parameters in ad URLs and enabling GA4 conversion (key event) tracking. For more on tracking your Facebook Ads, check out How to Track Meta (Facebook) Ads in Google Analytics Easily
What Is the Facebook Pixel, and do I need it if I use Google Analytics?
The Facebook Pixel is a tracking code that monitors user interactions on a website and links them to Facebook Ads. It helps optimize ad targeting and measure conversions. Even if you use Google Analytics, the Pixel is necessary for accurate Facebook ad tracking, retargeting, and audience insights. For more on installing a Facebook Pixel, check out How to Add a Facebook Pixel to WordPress (Easiest Way).
