Want to see how your website visitors are progressing and flowing through an analytics funnel on your website? A GA4 funnel exploration report can show you how successful your funnel is, plus where your website visitors are abandoning it. This makes funnels incredibly useful for analyzing how you can improve your website and grow your business.
With a Google Analytics funnel report, you can analyze any funnel on your site, including for eCommerce purchases, signups, donations, and more.
However, building a funnel exploration report isn’t super easy. Especially for GA4funn beginners, it can be pretty challenging!
In this article, we’ll show you step-by-step how to create a GA4 funnel exploration report. We’ll also go over an awesome shortcut for WooCommerce and Easy Digital Downloads users.
GA4 Funnel Exploration Video Walkthrough
What is a GA4 Funnel Exploration Report?
A Google Analytics funnel exploration report is a visual report that shows you how your visitors are navigating a funnel on your website, including where they’re abandoning it.
For example, if you have an eCommerce website, your funnel might look like this:
View an item » click add to cart » view the checkout page » complete a purchase.
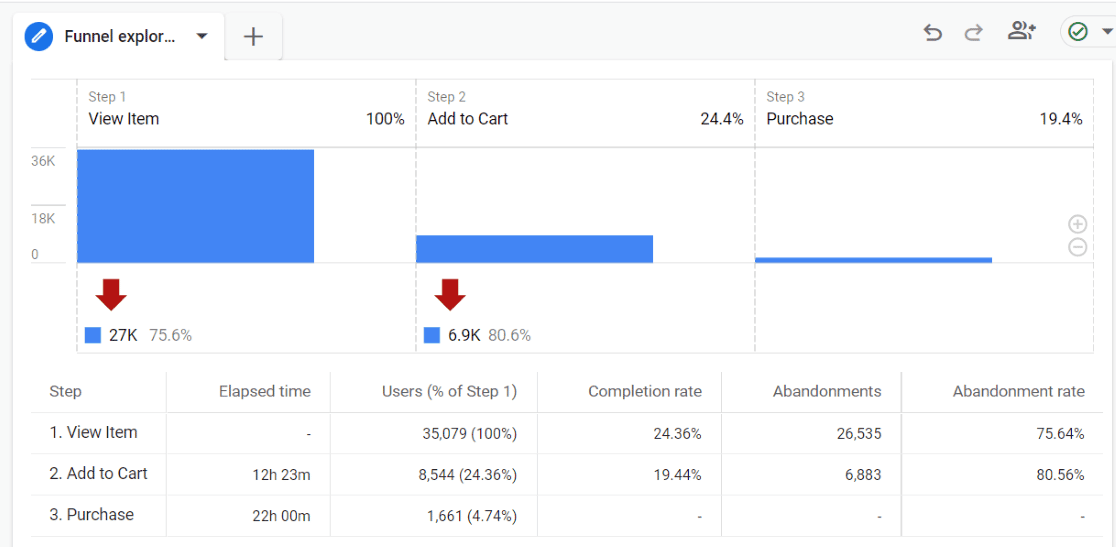
A funnel report will show you each step in your funnel and report how many users are abandoning it at each step.
If your goal on your website is to get users to submit a form instead, you might create a funnel with these steps: Landing on your site on any page » visiting the form page » visiting the thank you page.
How to Create a GA4 Funnel Exploration Report
Ready to create your Google Analytics funnel exploration? Let’s create one step by step.
Step 1: Create a Funnel Exploration
The first thing you need to do is head to Google Analytics, click on the Explore tab, then click on the Blank option:
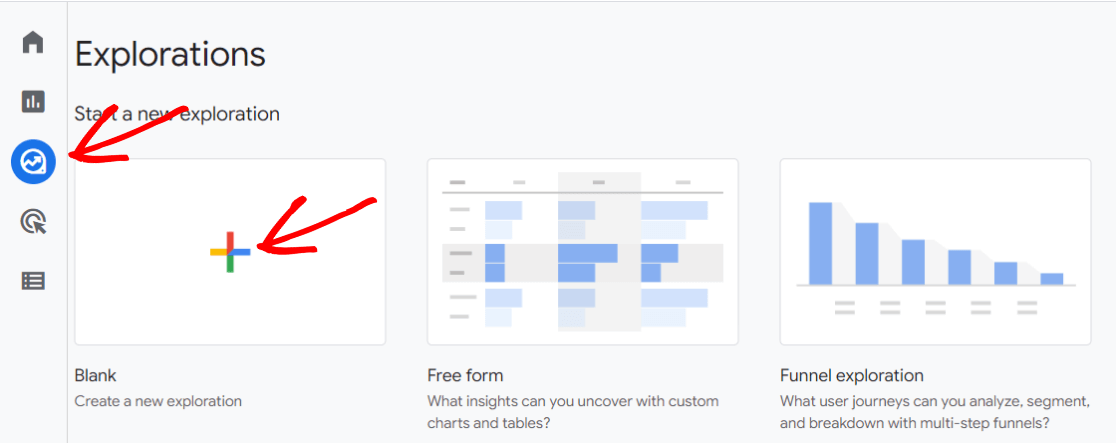
There is a Funnel exploration template that you can start with if you’d like to see an example funnel, but it can be confusing to start with when trying to create the funnel that makes sense for your website. Google sets it up with a bunch of settings already set.
Step 2: Choose Report Options
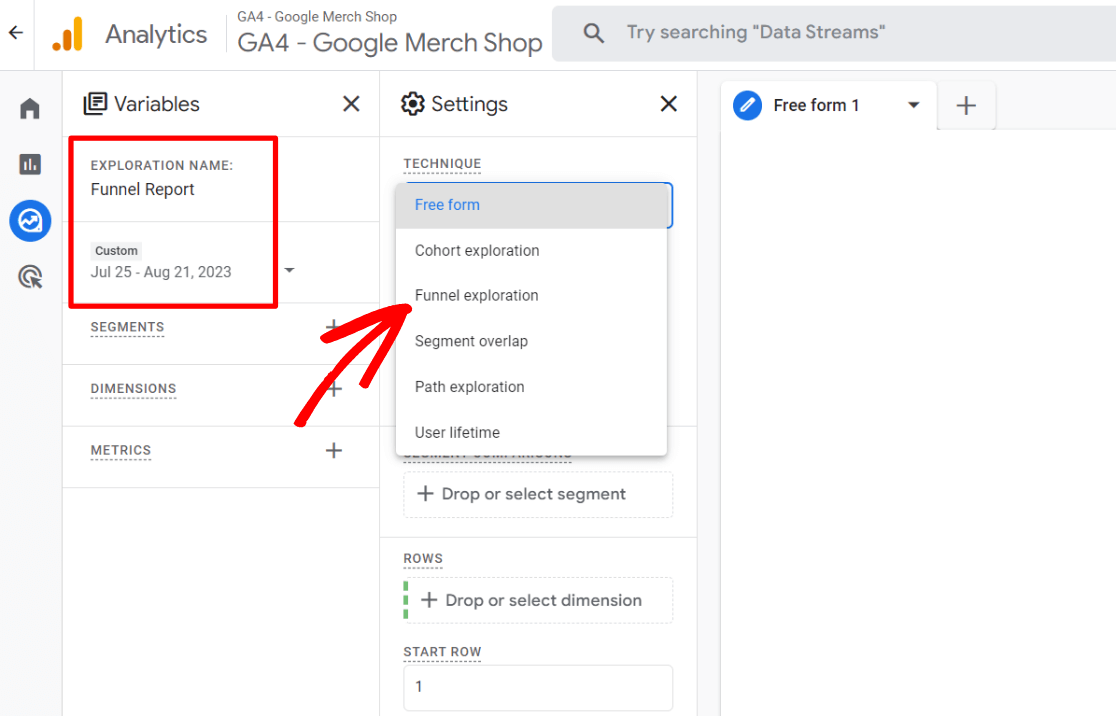
Now, we’ll give our report a name and choose the date span, then choose Funnel from the Technique dropdown:
Step 3: Add Steps
Now, it’s time to build out the steps of your funnel. To do that, start by clicking on the pencil icon in the Steps box:
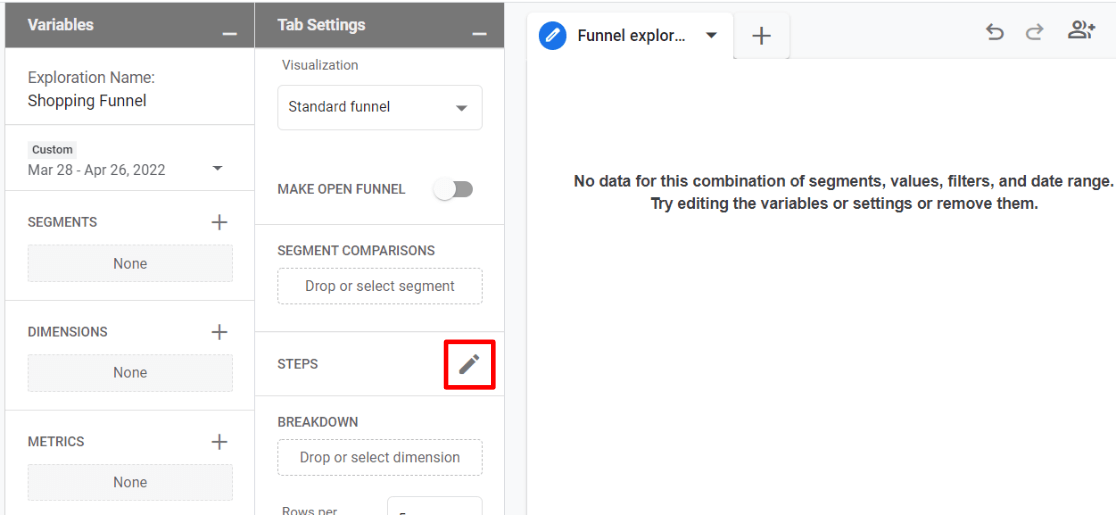
Here’s where you can create your funnel steps to build any kind of funnel you’d like. On the step building screen you’ll see where you can name your step, where to add a condition, and where to add another step:
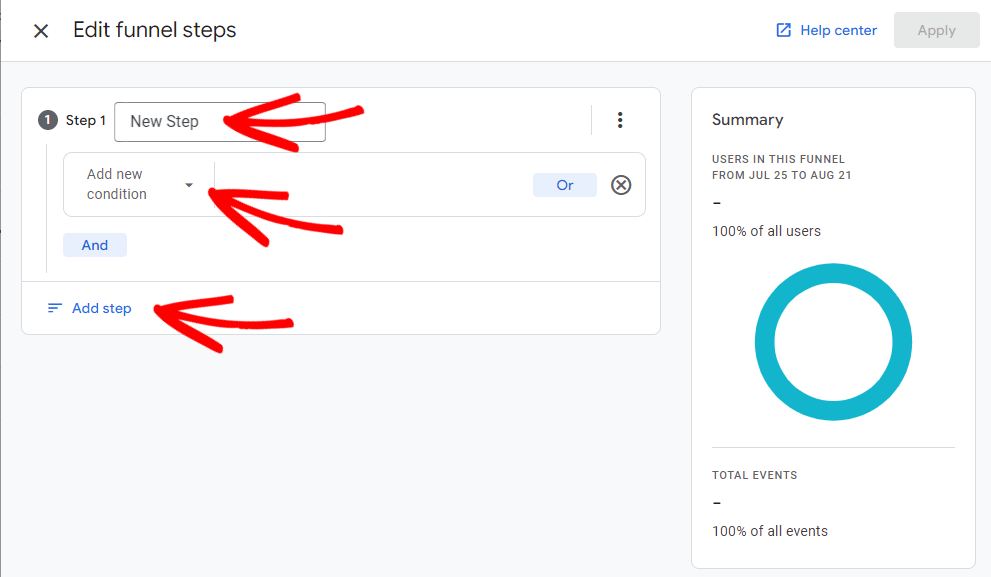
The Summary card on the right-hand side will change as you go to show you how many of your users will be included in your funnel. It’s a great help to make sure you’re building a funnel that’s error-free.
When you click into Add new condition, you’ll notice that there are tons of options for building your funnel. While this is awesome for building funnels, it can be pretty overwhelming for someone just learning how to use the report!
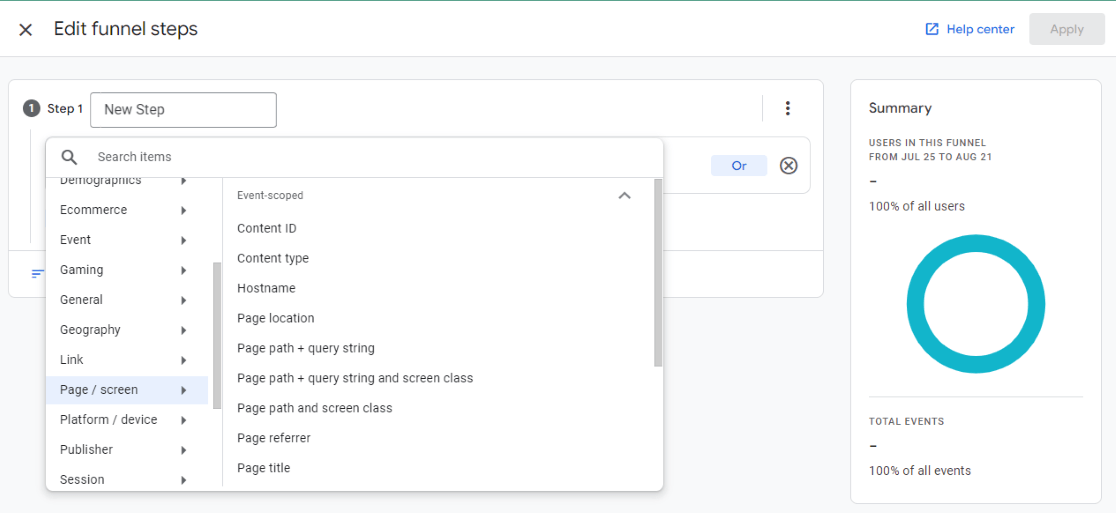
In general, if you’re building a funnel for your eCommerce store, you can use events for your steps like view_item, add_to_cart, and purchase. Or, you can choose to use page URLs that follow the exact steps of your checkout process, such as visiting the cart page, then the checkout page, then the confirmation page.
Let’s take a look at how the eCommerce funnel steps would look if we used the events:
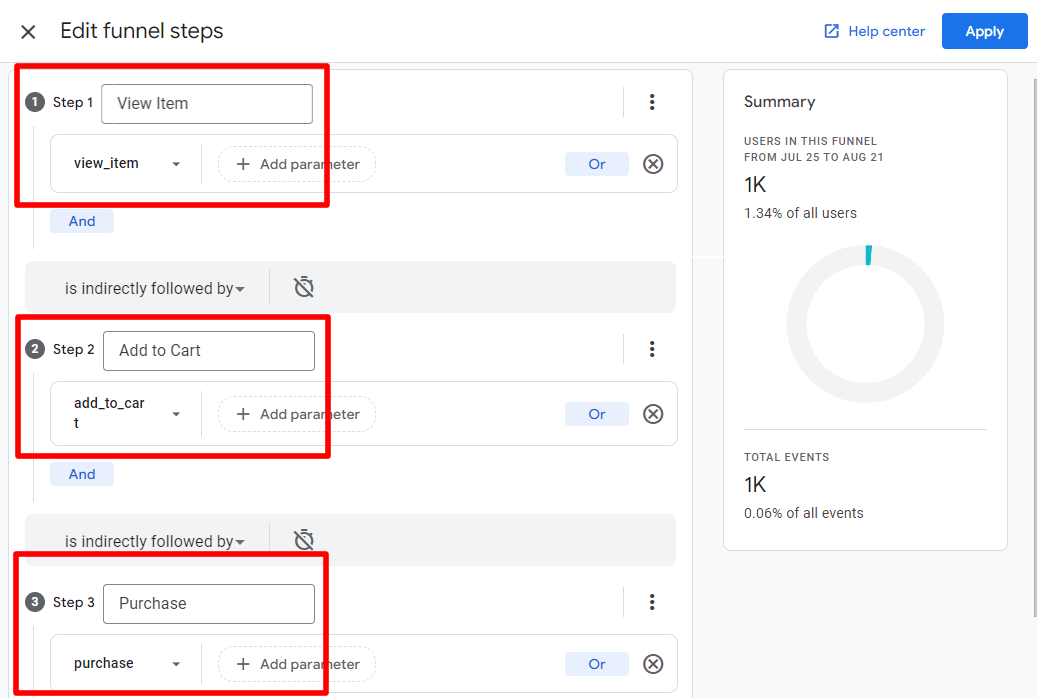
You can see that using view_item in step one, add_to_cart in step two, and purchase in step three is going to result in about 1,000 users after applying the funnel in the report’s date range.
So, after we click Apply, we get our eCommerce funnel report:
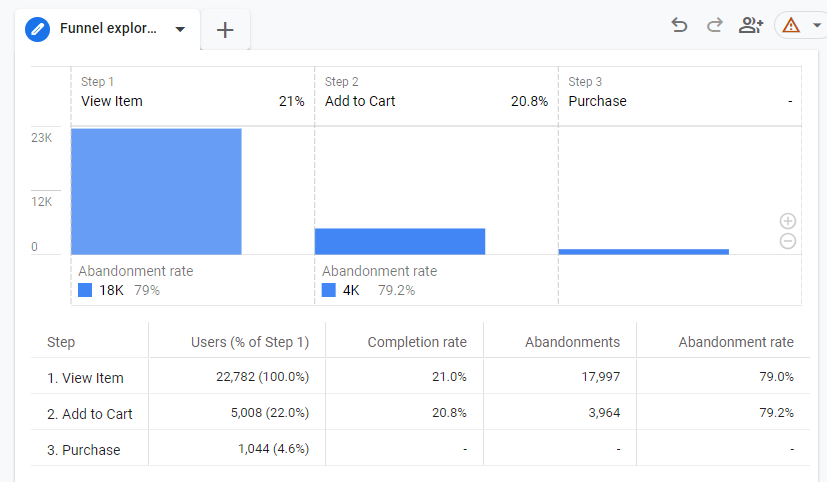
At each step, you can see how many users completed the step and how many users abandoned your funnel at that point. So, in the example above, the abandonment rate is 79% at step one. That means that, of the users who viewed an item, 79% left without ever proceeding to add an item to their cart. Of the people who did add an item to their cart, 79.2% left without completing the purchase.
Step 4: Review Google’s Example
To really get an idea of what’s possible with funnel reports, let’s take a look at Google’s example. Head back to the Exploration tab, then click on Funnel exploration:

You’ll see a report that’s made automatically. Notice how they have Device category in the Breakdown box – that makes the funnel show the device category for each step:
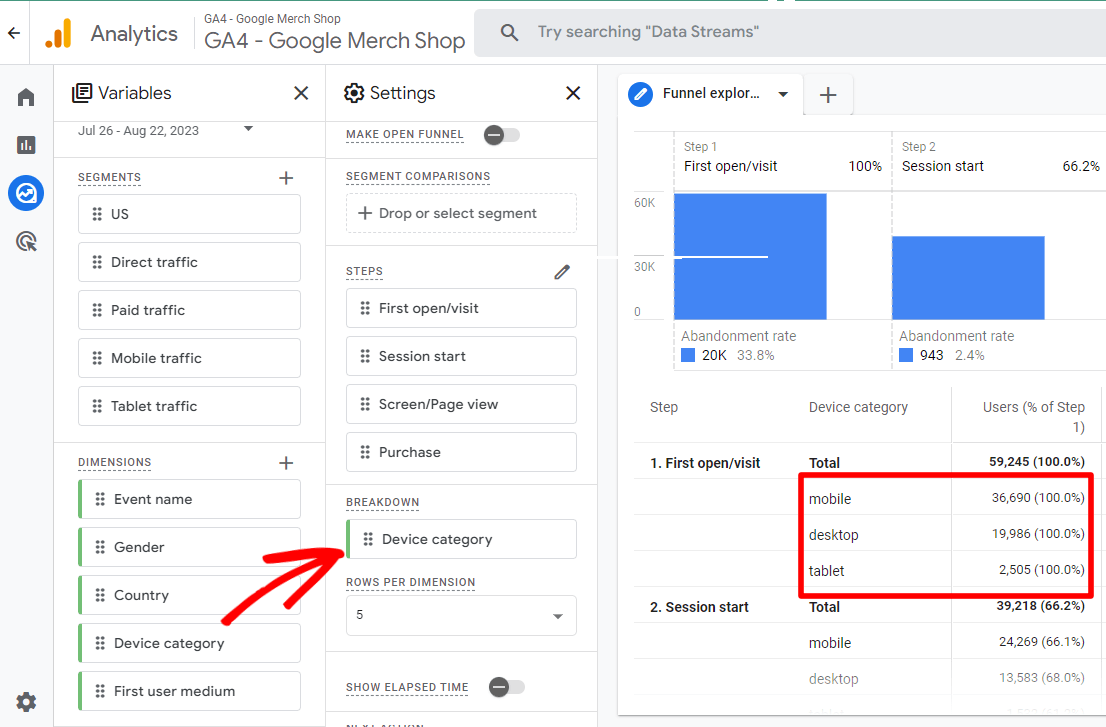
This is super useful for seeing how traffic from each device is navigating your site. Does one have a much larger abandonment rate than the others? Maybe those users are finding it difficult or confusing to navigate your site.
They also have pre-loaded segments in the report. Try dragging two of them into the Segment Comparisons box to see how that changes the report:
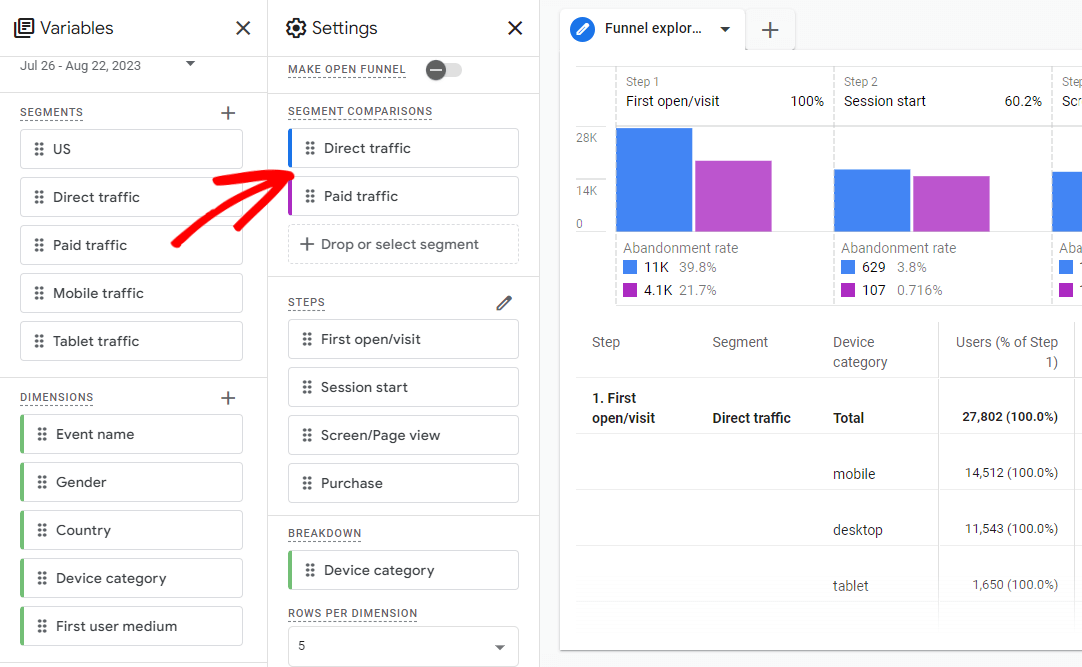
Learn more about segments here: Google Analytics 4 Segments: Beginner’s Guide
There are so many possibilities with funnel reports! The best way to learn how they work is to just play around with building them.
eCommerce Funnels in WordPress the Simple Way
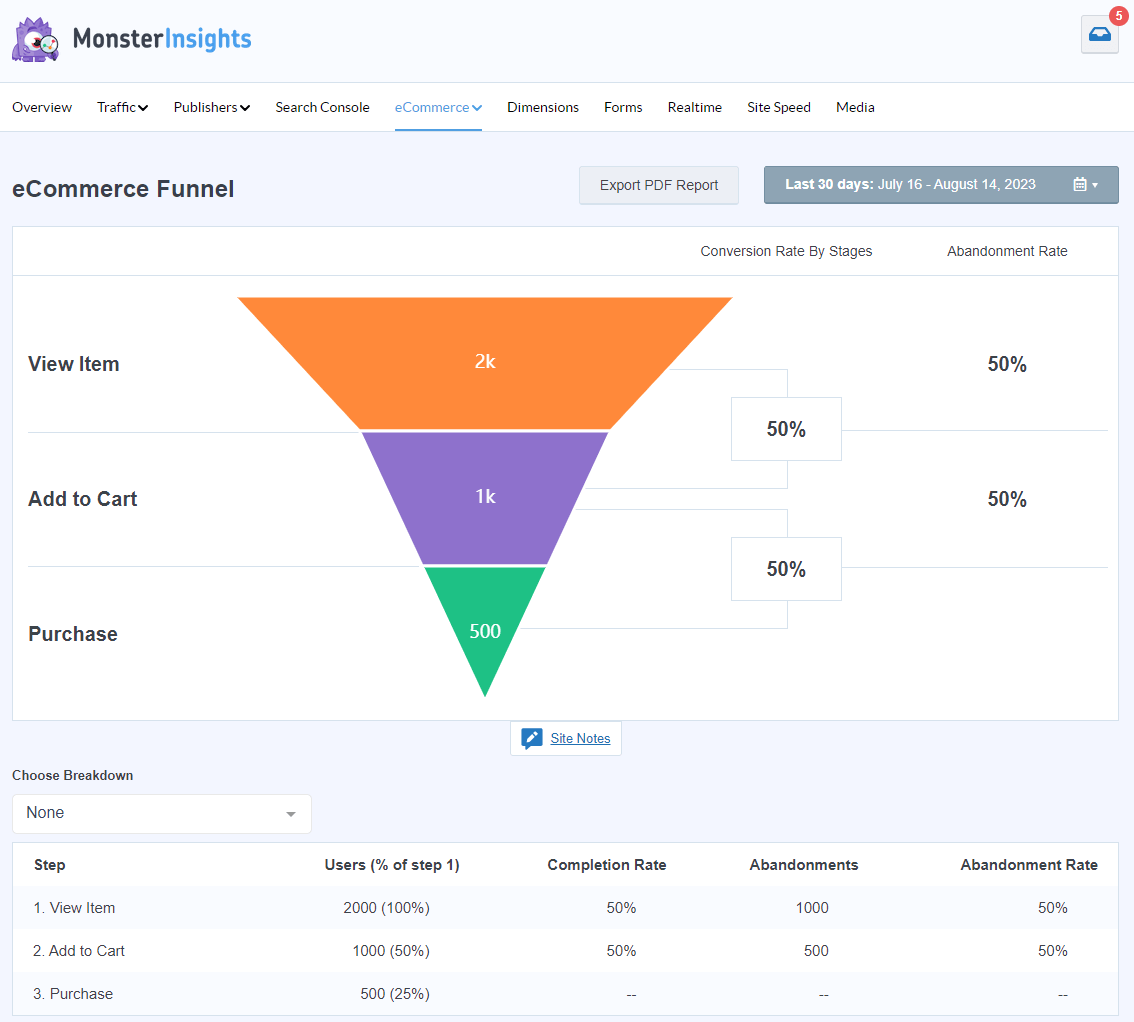
If you’re a WordPress and WooCommerce or Easy Digital Downloads user, there’s a much easier way to see an eCommerce funnel report. Just install MonsterInsights and we’ll make one for you!
MonsterInsights is the best Google Analytics plugin for WordPress. It allows you to easily connect your WordPress site with Google Analytics (with no need to touch any code) so you can view all the data that matters most right in your WordPress dashboard.
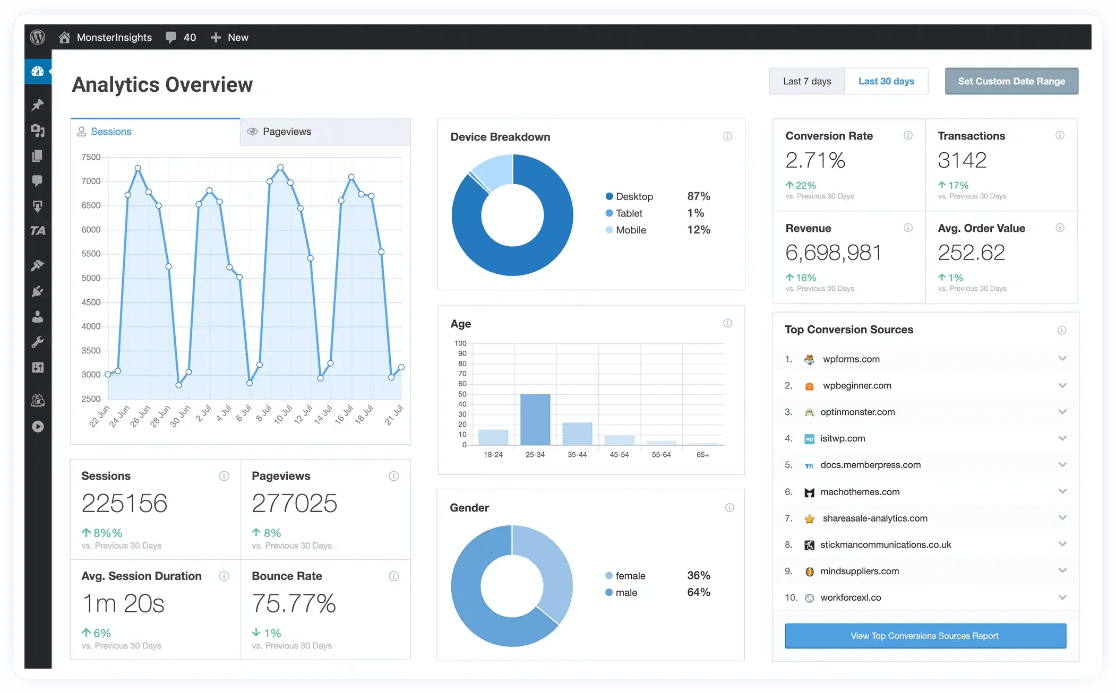
Plus, with the click of a button, you can set up sophisticated tracking features such as event tracking, eCommerce tracking, user journey tracking, form tracking, custom dimension tracking, outbound link tracking, and more.
Once you have MonsterInsights Pro installed and set up, it’ll automatically create an eCommerce funnel report for you, right inside your WordPress dashboard.
You’ll get a whole list of reports, including:
- Landing page conversions
- eCommerce summary
- User journey report for each purchase
- Campaigns
- Site speed
- Search Console queries
- And more!
Get started with MonsterInsights now.
To recap: How do you set up funnel explorations in GA4?
- In the Explorations tab in Google Analytics, click to create a Blank report.
- Give your report a name, choose a date span, and pick Funnel exploration from the Technique dropdown.
- Add steps to your report.
- Review Google’s example report to get a feel for everything funnel reports can do!
We hope you learned a lot about creating GA4 funnel exploration reports. You might also want to check out:
How to Create Google Analytics 4 Custom Reports (Step by Step)
How to Track Add to Cart Events in Google Analytics (Easy Way)
11 Best WordPress Sales Funnel Builder Plugins
eCommerce Customer Journey Analytics: WordPress Guide
9 Top eCommerce Metrics & KPIs to Track in Google Analytics 4
Not using MonsterInsights yet? What are you waiting for?
And don’t forget to follow us on Twitter, Facebook and YouTube for more helpful Google Analytics tips and tutorials.
