Here at MonsterInsights, we’re all about providing businesses with the data-driven insights they need to grow. We know it can seem complicated, though, to translate those insights into results. How can you actually use your MonsterInsights dashboard reports to grow your business?
We’re here to help! Let’s take a look at a real company with a WordPress and WooCommerce website as an example, so you can gather some inspiration about how to use MonsterInsights reports for your own site.
About the Vermont Evaporator Company
For this case study, we’ll be looking at the Vermont Evaporator Company, a small, family-run business that sells maple syrup evaporators and other maple syrup-making supplies to hobbyists, institutions, and more.

About MonsterInsights
MonsterInsights is the best Google Analytics plugin for WordPress. Not only does it connect Google Analytics to your website in a couple of clicks, but it also adds advanced tracking features that you don’t get out-of-the-box with Google Analytics. Plus, you’ll get most of the data you need to grow your business right inside your WordPress dashboard.

That includes setting up WooCommerce tracking! All you have to do is activate the eCommerce addon, and we’ll take care of the rest. Without MonsterInsights, you’d need to hire a developer or learn Google Tag Manager.
For an introduction to MonsterInsights and how it works with Google Analytics, check out MonsterInsights vs. Google Analytics.
Translating Insights Into Impact With MontserInsights
Now, let’s dive into our case study about how the Vermont Evaporator Company might use MonsterInsights to grow its business. To do that, we’ll look at the top five MonsterInsights reports and features that would be the most impactful.
1. The MonsterInsights eCommerce Report
As we mentioned above, adding eCommerce tracking to a WooCommerce site is incredibly easy with MonsterInsights. Just activate the eCommerce addon, and tracking will automatically be set up. Not only that, but you’ll also get your top most important eCommerce metrics right inside your WordPress dashboard:
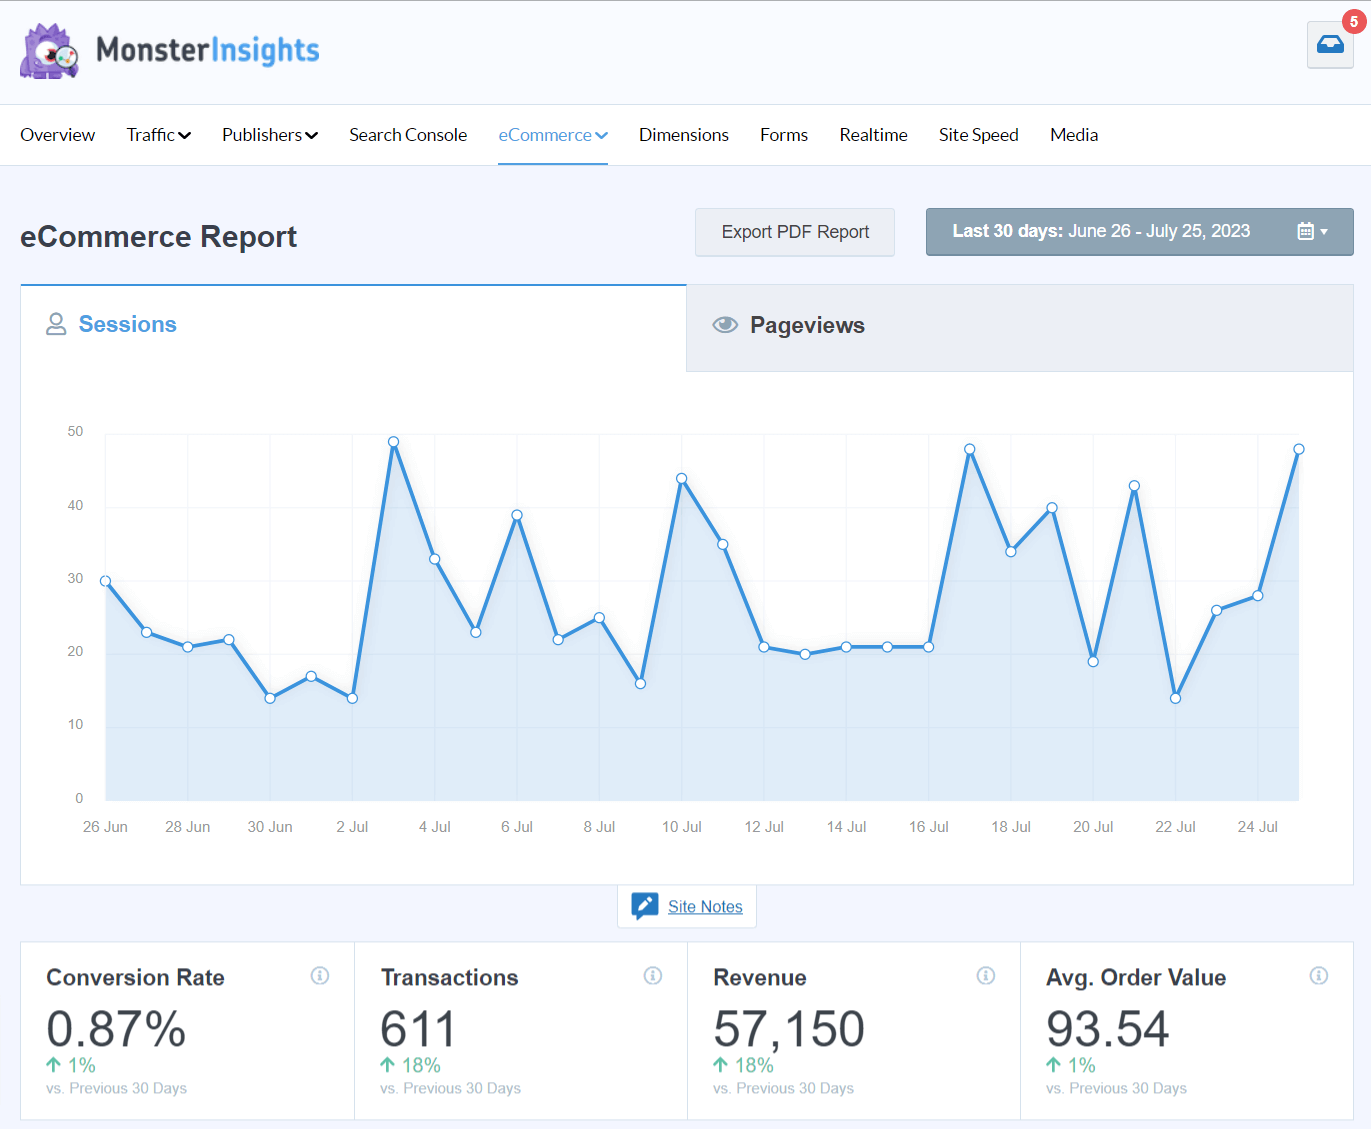
That includes not only the basic eCommerce metrics but also your:
- Top-selling products, including each item’s revenue, quantity sold, and percentage of sales
- Top-converting traffic sources, including your revenue for each source
- Total add to carts and removed from carts
- Percentage of new customers
- Percentage of abandoned checkouts
- Coupon usage
- eCommerce funnel
So, how might the Vermont Evaporator Company use this data to grow its business?
First, let’s look at the top products report:
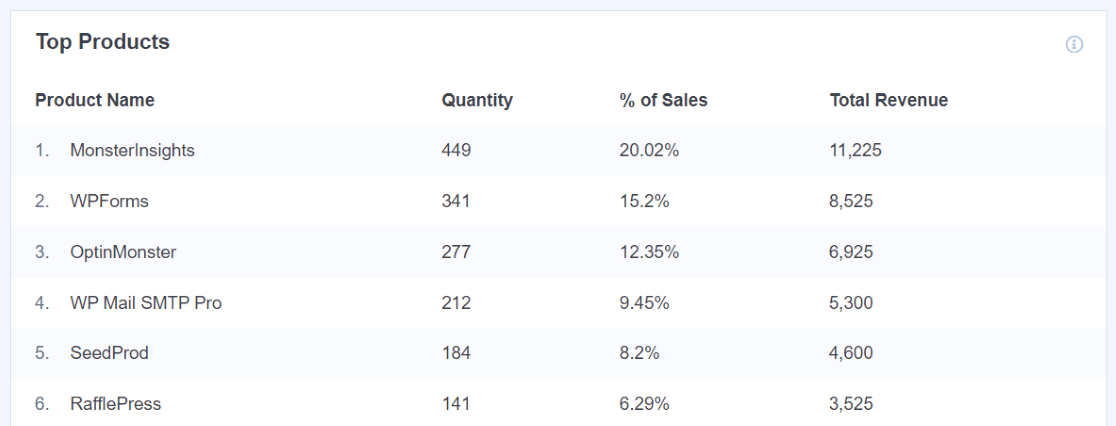
The Vermont Evaporator Company sells primarily evaporators, but it also sells some other equipment you might need when starting to make DIY maple syrup, like tap kits, sugaring pans, tubing, and more.
Let’s say that, down in position number 5 in the report, the company’s team sees their tap kits. Since this is such a fundamental need when starting to make maple syrup, they wonder why the tap kits aren’t more of a top seller.
So, based on that information, they decide to add a couple of suggested products to the checkout page when someone is purchasing an evaporator. Sure enough, that helps buyers notice that they can purchase those extra supplies along with their evaporator.
Over the next month, the team watches as their tap kits rise in the Top Products report, and revenue is up overall.
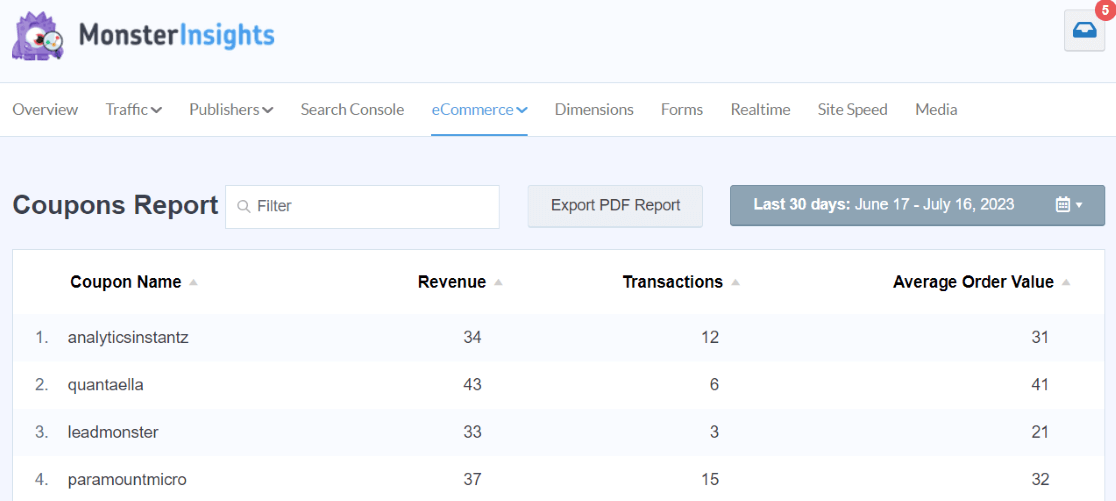
They could even try running a special coupon for when you buy both products together and track the coupon usage in the Coupons report:
Related: 25 Crucial eCommerce Growth Strategies to Raise Your Revenue
2. The PPC Ads Addon + Campaigns Report
We noticed that the Vermont Evaporator Company is running a couple of experimental Meta (Facebook) Ads. First, to add the tracking pixel to their site without modifying any code or having to use Google Tag Manager, they can just install the PPC Ads Tracking addon and paste their pixel:

Next, it’s important to use UTM parameters when setting up Meta ads. Without adding these special bits of code to the end of the URL you use in your ad, Google Analytics will lump that paid Facebook traffic in with any other traffic you’re getting from Facebook.
If they haven’t used UTM parameters, they’ll find their Facebook traffic inside the MonsterInsights dashboard under Traffic » Social, including sessions, engaged sessions, purchases, revenue, and more:
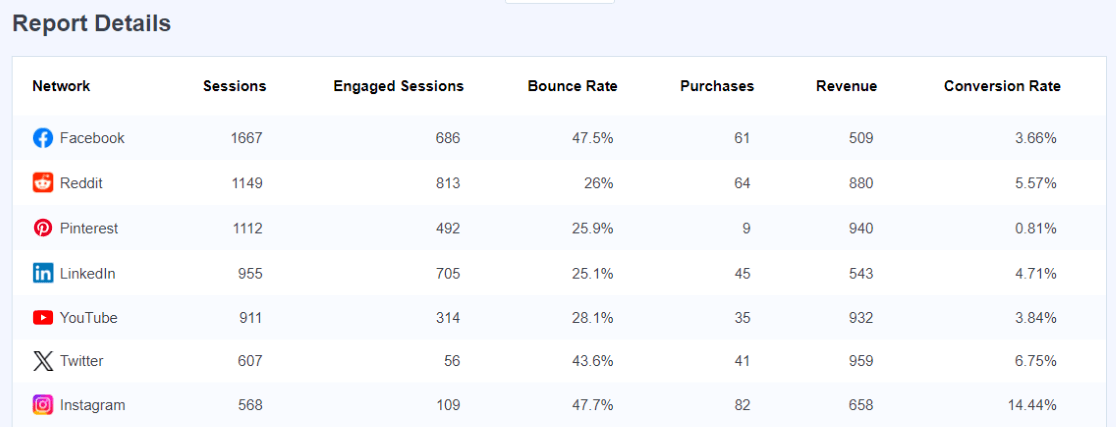
For the sake of our case study, let’s say they used UTM parameters on their ad links. In that case, Meta ad traffic will be in the Traffic » Campaigns report:
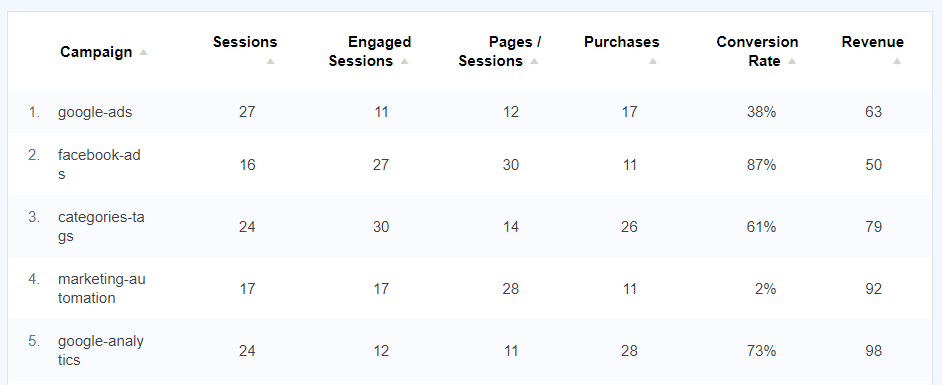
In the above report, the facebook-ads campaign has a conversion rate of 87%. That’s HUGE! The Vermont team could use this information to decide to run multiple more ads, bringing in more new customers and/or new newsletter signups.
That’s a huge win!
Related: 9 Facebook Ad Targeting Tips to Skyrocket Your Conversions
3. The Landing Pages Report
Let’s move on to the Landing Page Details report. This report gives you a ton of important information, including the number of sessions, purchases, and revenue for each top landing page:
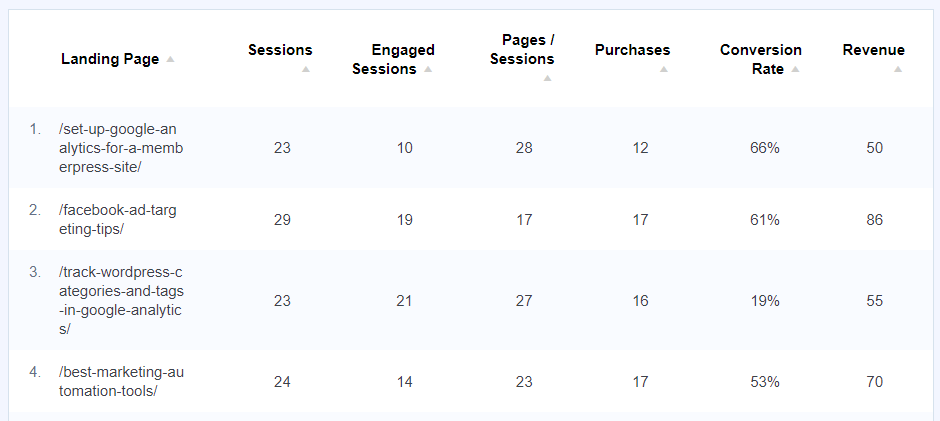
The team at Vermont has created some awesome guides around sugaring for beginners, cooking with maple syrup, making candy with maple syrup, and more. These guides serve as great entry points for their audience.
Let’s say that one of their blog posts, How to Tap a Maple Tree, is one of their top landing pages, but it’s not converting very many of those visitors into leads or customers, so it has a very low conversion rate.
While that’s not exactly happy information, they now know that they need to improve the article to convert more visitors. So, they create a downloadable PDF guide on maple sugaring for beginners and provide it in a popup on that page that appears after a visitor is on the page for 15 seconds.
That guide raises the conversion rate for the page significantly, and they’re now adding some super-qualified subscribers to their email list.
Another pretty easy, effective way to use the Landing Page Details report is to think about what’s not on it. What’s a cornerstone blog post that’s not bringing in traffic, but you really wish it was because it’s important? Here’s your sign that your content could be better optimized, you could publicize and share it more, or you need to hone in on the search intent for it.
Related: Google Analytics 4 Landing Pages: Reporting Guide
4. The Search Console Report
As long as you connect your Google Analytics and Google Search Console accounts, the Search Console report tells you what keywords you’re ranking for in Google’s search results, including each keyword’s clicks, impressions, click-through rate (CTR), and average position:

This report is incredibly useful for growing your traffic!
Let’s say that the Vermont Evaporator Company team sees that they’re ranking really well (around 4th) for the term “maple syrup evaporator,” but the click-through rate is one of the lowest in the top 10 keywords.
When that happens, it’s time to evaluate. Open an incognito or private browser to search the keyword yourself. What do you notice about the other results compared to yours? What’s ranking at the top of the page? How could you change or optimize the page you have that’s ranking to nudge it up higher or make it stand out?
If you think about all of your top keywords that have a lower CTR this way and make changes, you’ll increase your organic traffic.
For the Vermont Evaporator Company, that might mean adding more SEO content to their home page, trying shopping ads on Google, building backlinks by creating linkable content, and more.
Related: How to Increase Organic Traffic (12 Best Ways)
5. The User Journey Report
Did you know that it’s possible to see what customers look at on their way to their cart? You can see exactly what steps they take from when they land on your website until they make it to the confirmation page after completing their purchase. Just install the User Journey addon in MonsterInsights to add a User Journey Report dashboard with dates, UTMs, and steps to purchase:

Plus, you’ll be able to see each individual user journey report inside your WooCommerce transactions (even if a transaction took multiple days and multiple visits to complete):
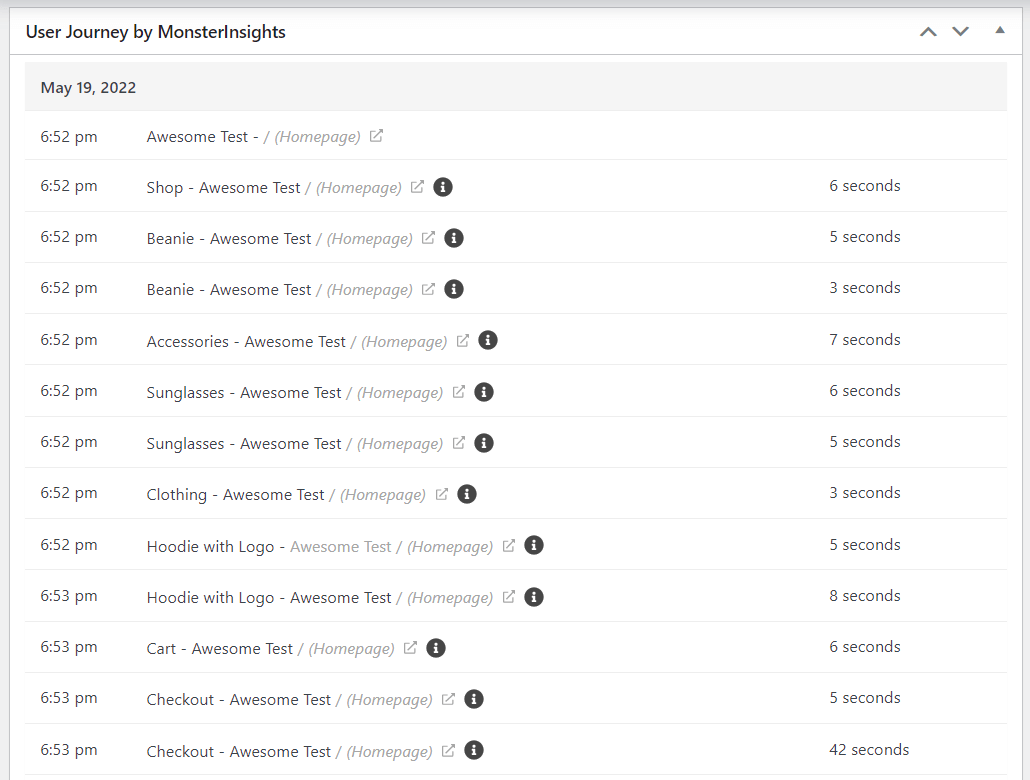
When you can see the different journeys your customers take across your website to complete their purchases, you can make smart changes to optimize and speed up their journey.
For example, let’s say the Vermont Evaporator Company team notices that many customers abandon their carts at first and then return a few days later to complete their purchase. To help more buyers complete their purchase right away, they add more information on the cart page about easy returns, offer free shipping, and make sure the cart pages are optimized to load quickly. This decreases the number of days that the average customer checks out.
Related: 12 Smart Tactics to Reduce Shopping Cart Abandonment
That’s it!
I hope you found this case study helpful as you learn how to take the data in your MonsterInsights reports and turn it into the updates and tactics that will grow your business.
To get started with MonsterInsights on your own eCommerce (or any other type of) website, grab MonsterInsights Pro today.
If you liked this case study, make sure to also check out:
[Case Study] 7 Ways WPBeginner Uses MonsterInsights to Grow Their Business
32 Marketing Hacks Guaranteed to Grow Your Traffic
How to Increase Organic Traffic (12 Best Ways)
Finally, don’t forget to follow us on YouTube for more helpful reviews, tutorials, and Google Analytics tips.
