Even if you’ve just started your website, you’ve likely heard of Google Analytics, but what exactly is Google Analytics?
Google Analytics is a free tracking and statistics software that gives you vital insights on how visitors find your site, what they do when they get there, and other important information on the health of your business: such as eCommerce and lead conversions.
This overview of Google Analytics is designed to introduce you to the major areas of Google Analytics and help you get started viewing your site visitor stats quickly
For a quick walk through, check out the video below.
Google Analytics Overview

In this section for Google Analytics, we will be covering the following:
- Introduction to Google Analytics Reports
- Introduction to Google Analytics Explore
- Introduction to Google Analytics Advertising
- Configure your Google Analytics property
Introduction to Google Analytics Reports
The reports section contains the following reports:
- Reports snapshot
- Realtime
- Acquisition
- Engagement
- Monetization
- Retention
- User Attributes
- Tech
There are a few types of reports: an overview or snapshot report and a detailed reporting view. Detailed reporting can be customized if needed. Please check out Google’s guide for more information here: Customize detail reports.
The Reports snapshot gives you an overall view of different reports. These reports are displayed on “cards” and can be clicked on for a more in-depth look at that data.

Realtime reports are where you can see users interacting with your site in real-time. This report shows the activity of users within a 30-minute window and also has “cards” that can be clicked on for further data.

In the Acquisition report we will find three sub-reports:
- Acquisition overview
- User acquisition
- Traffic acquisition
The Acquisition overview lets you view what source users used to get to your site. You can also find your Google Ads campaigns here as well.
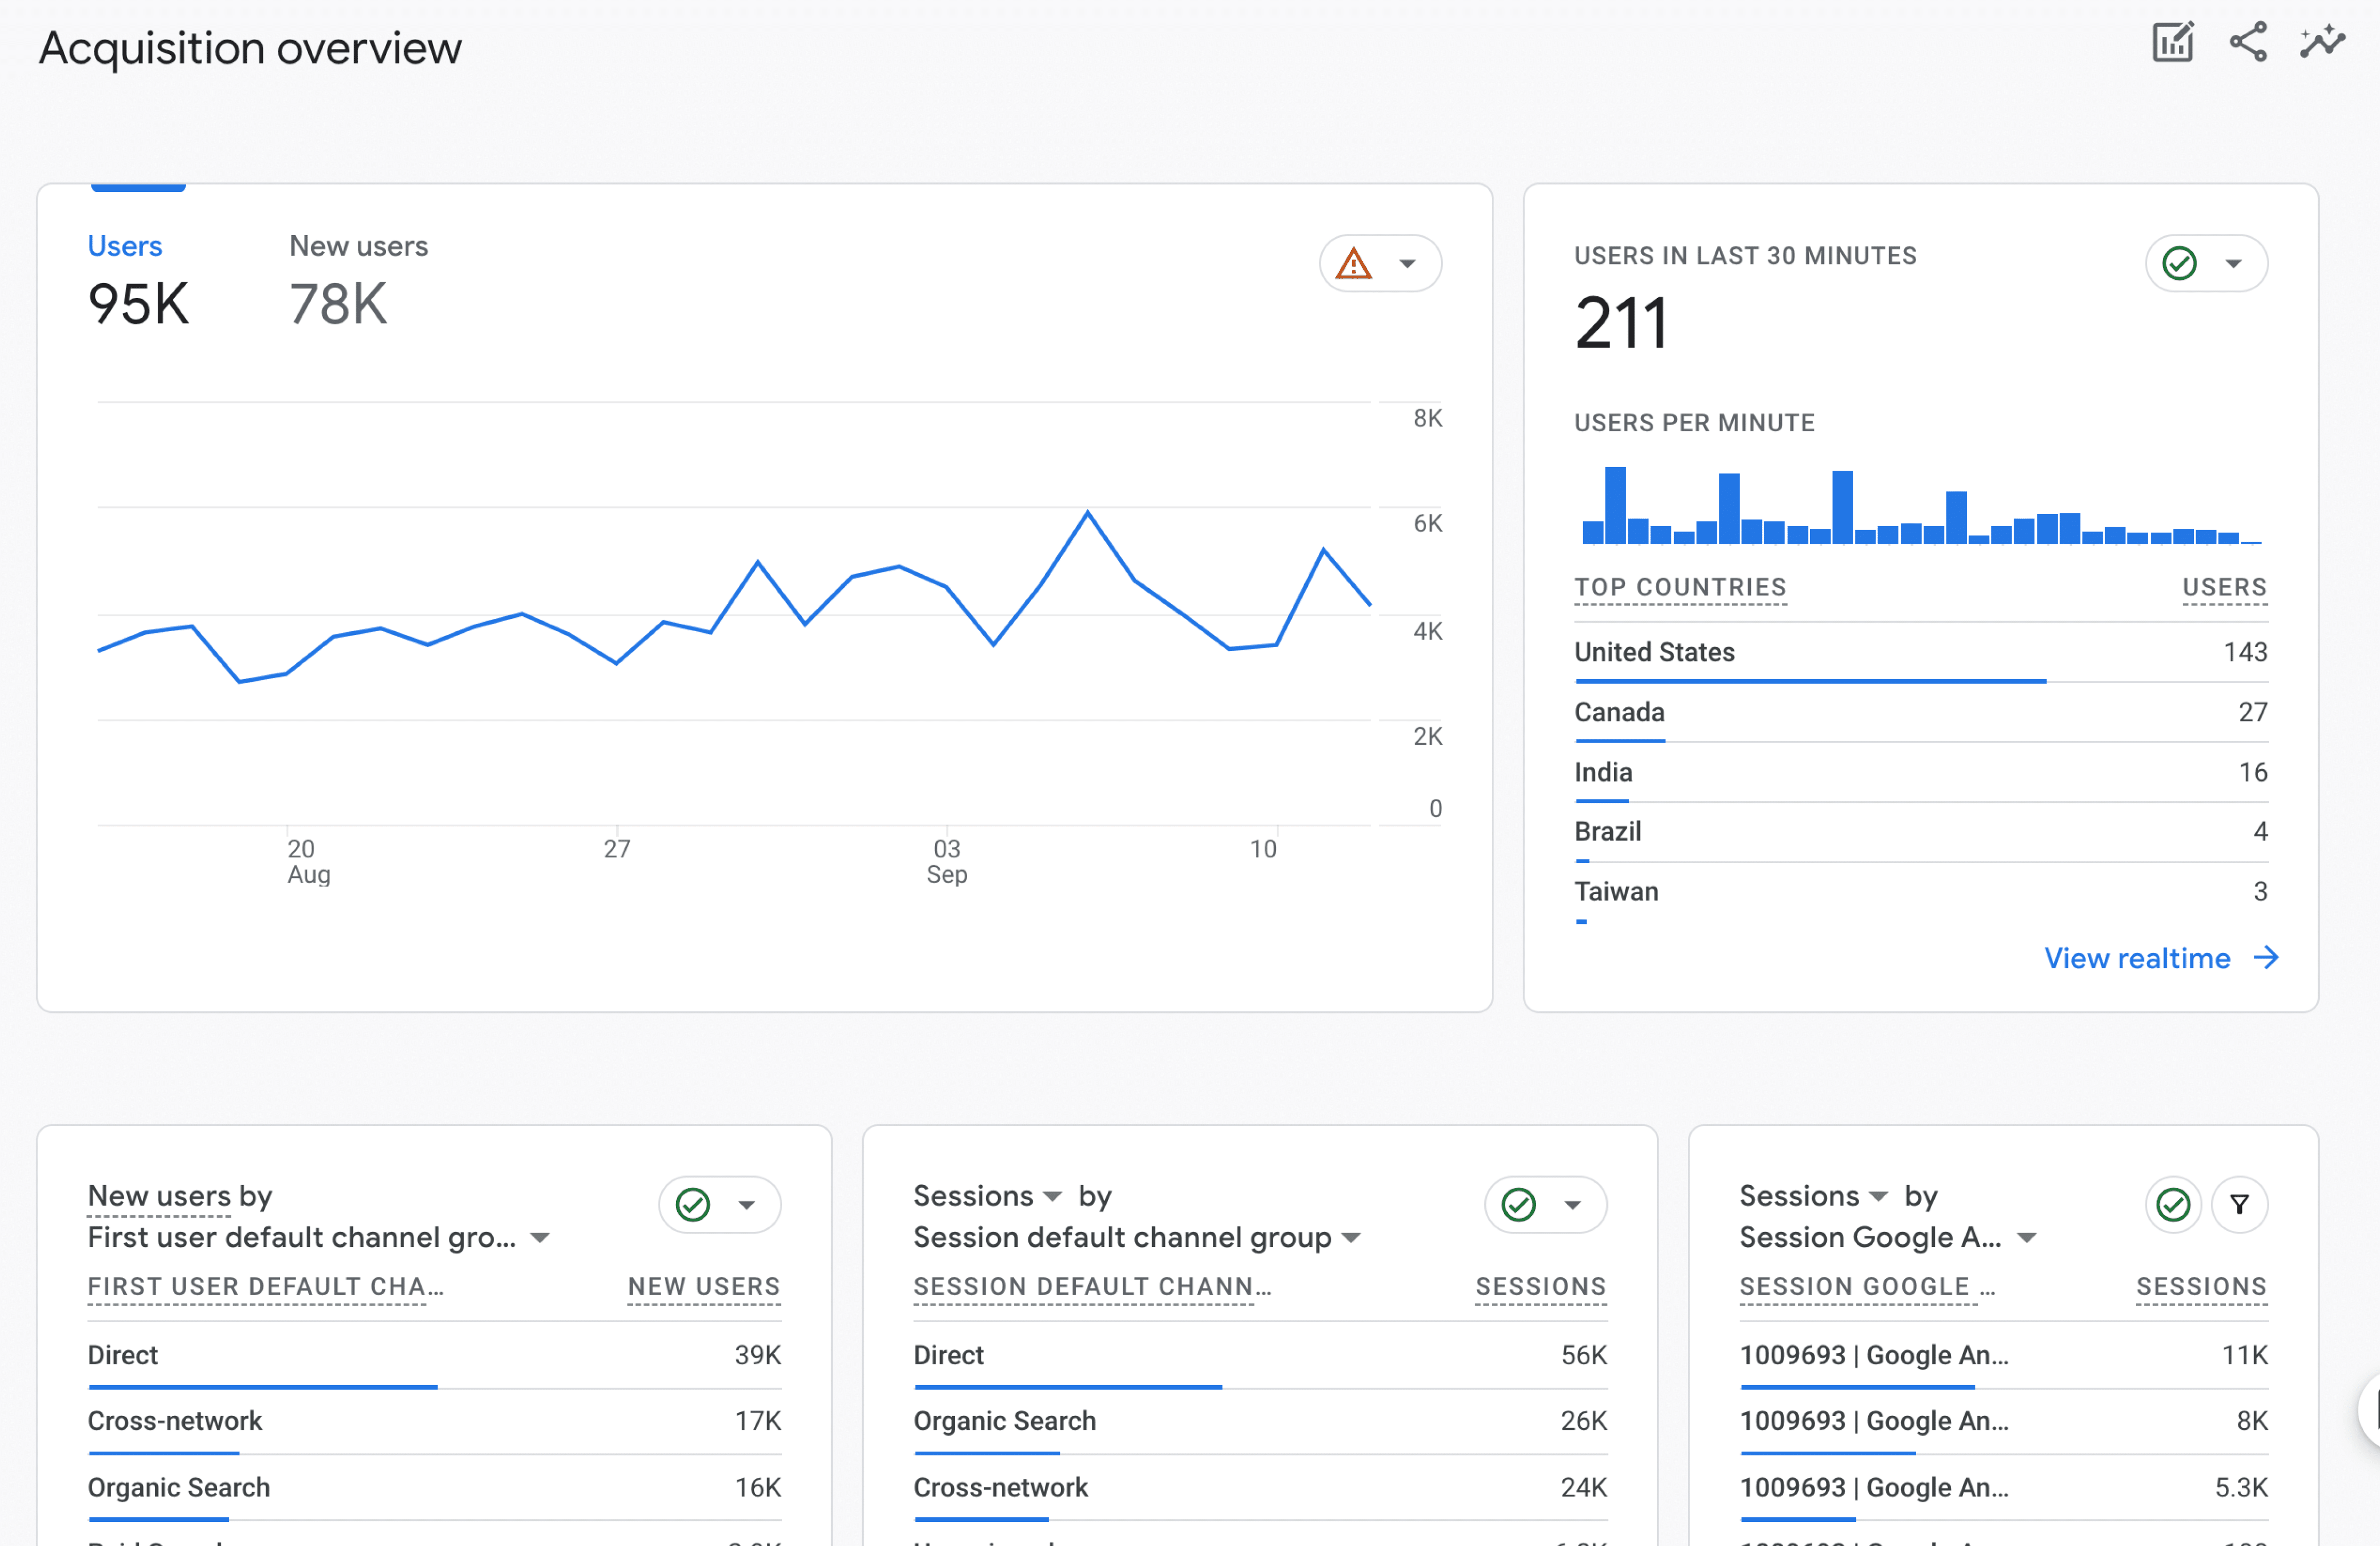
In the User acquisition, you will find a more detailed report about the source of where your new users came from. This is not for returning visitors.

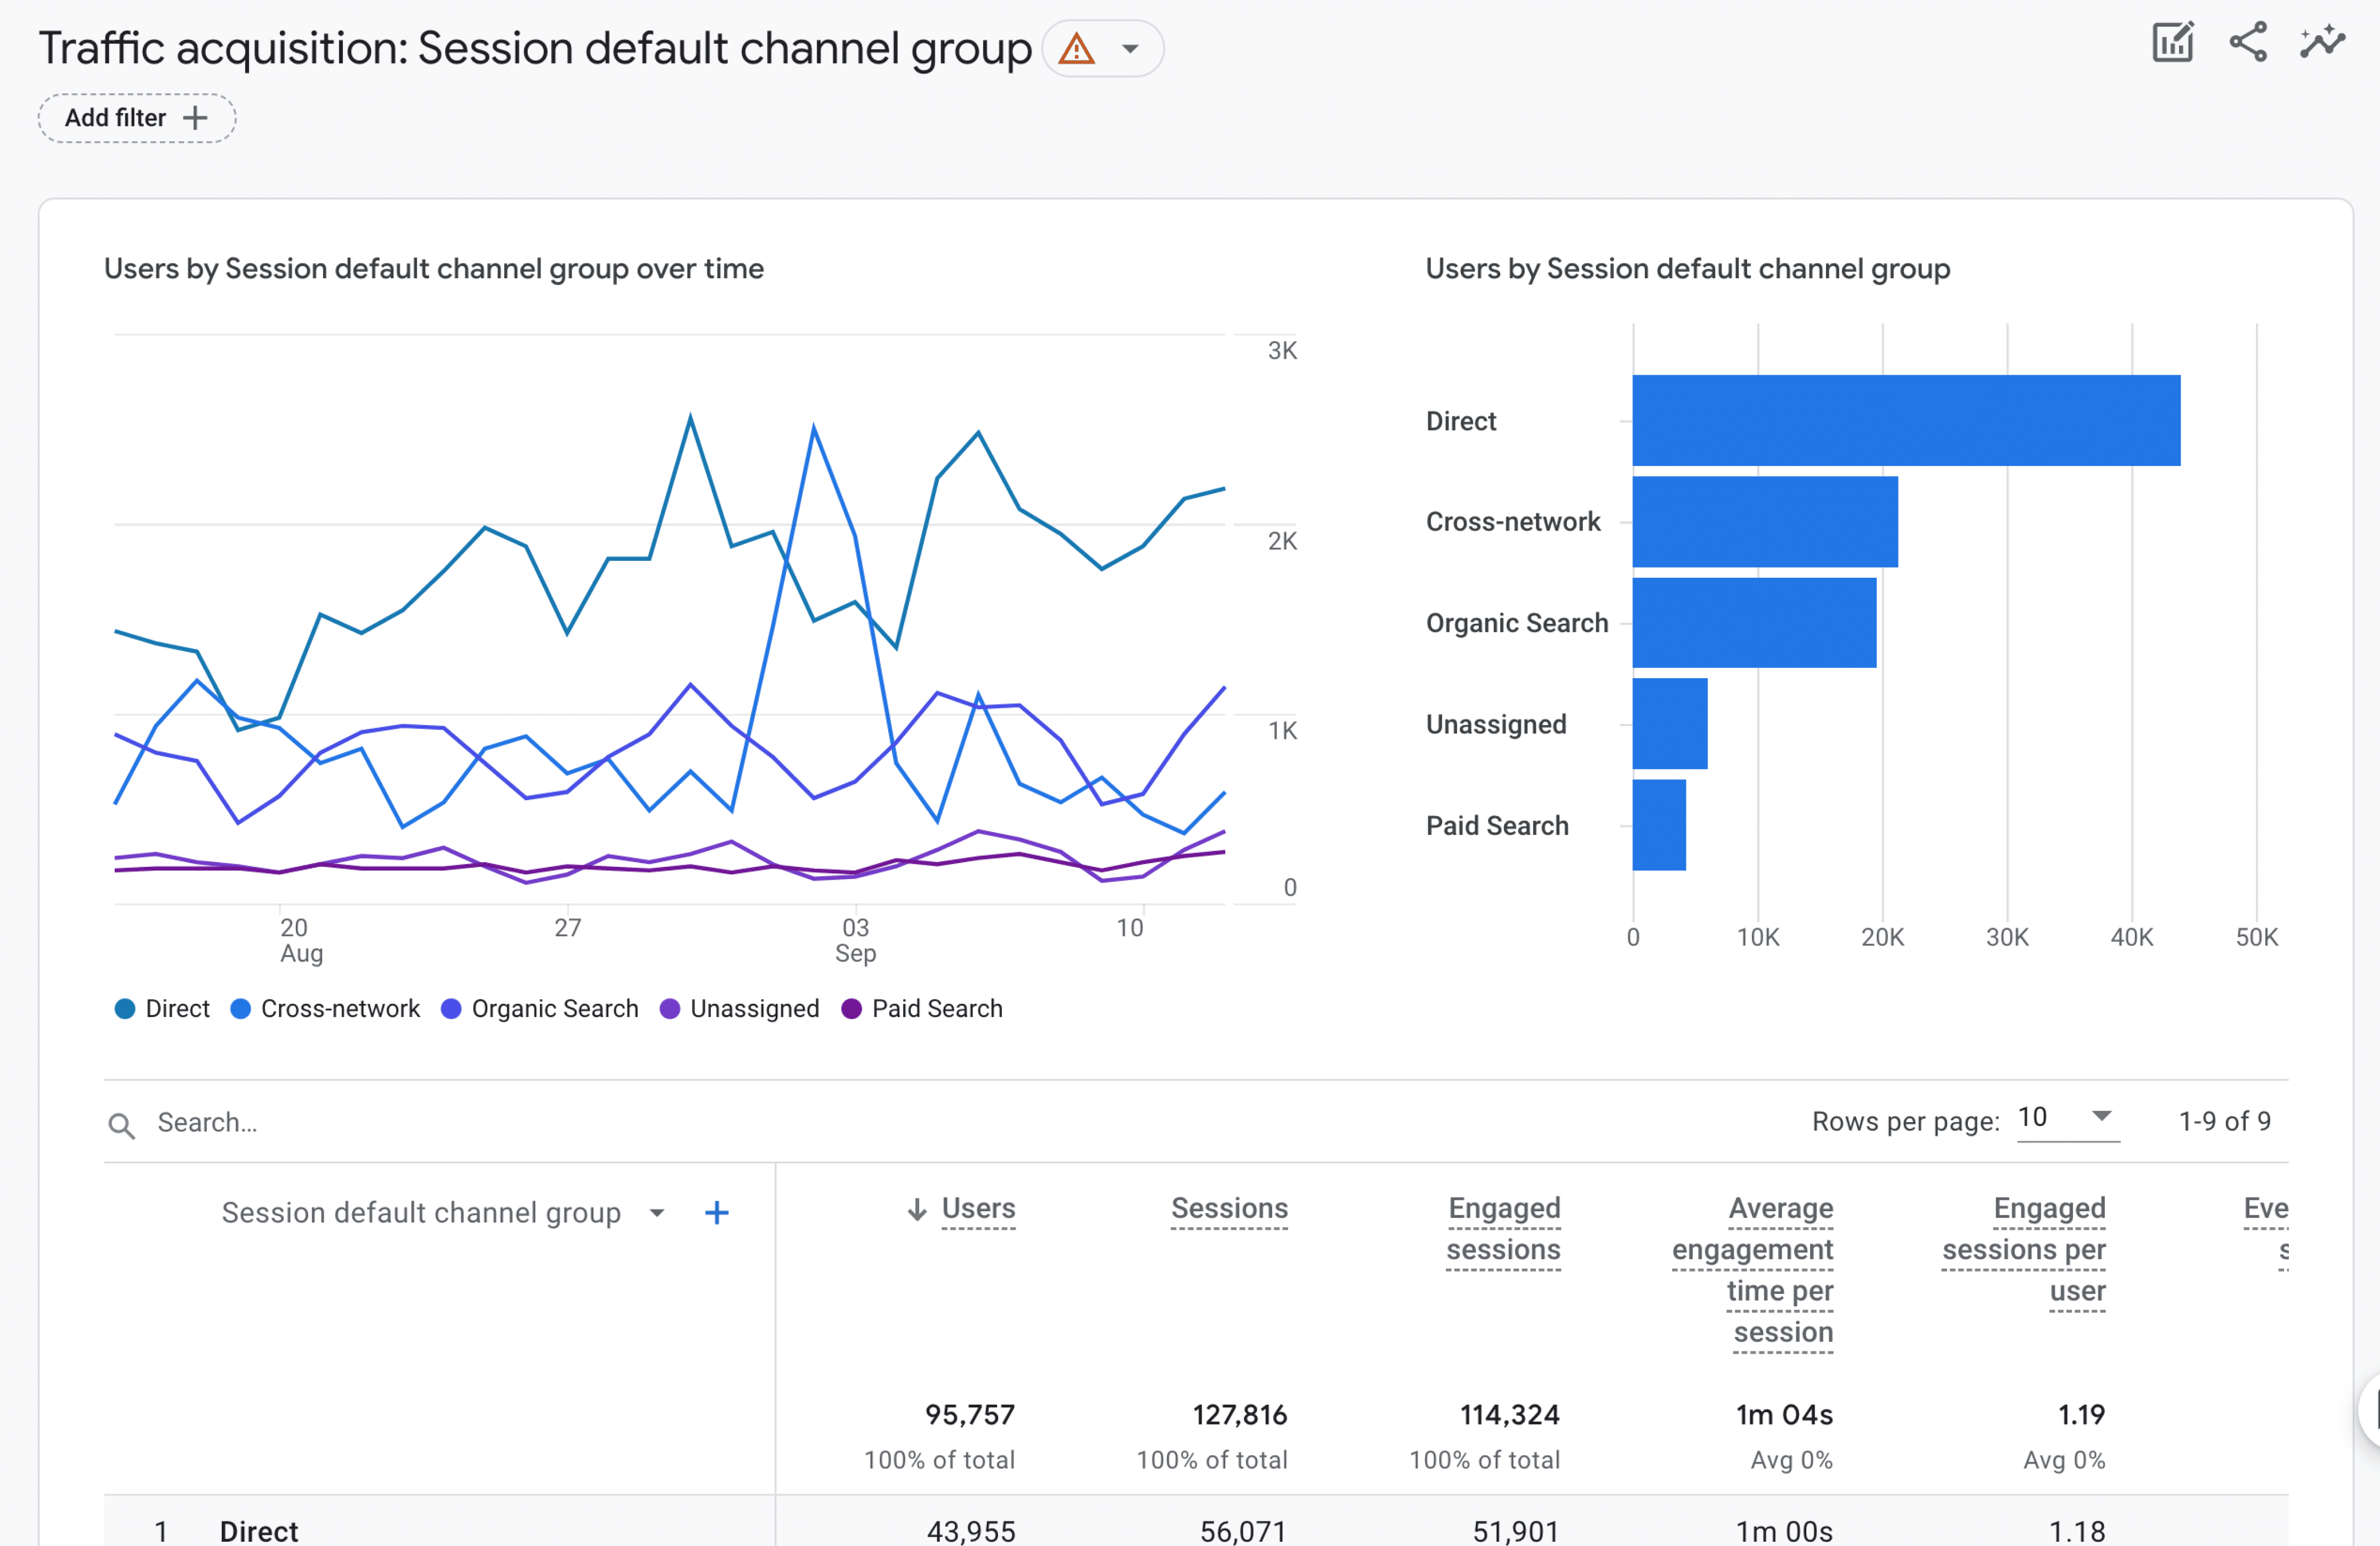
Lastly, Traffic acquisition shows the session source/medium data of users to your site.
In the Engagement section you will find the following sub-reports:
- Engagement overview
- Events
- Conversions
- Pages and screens
- Landing Page
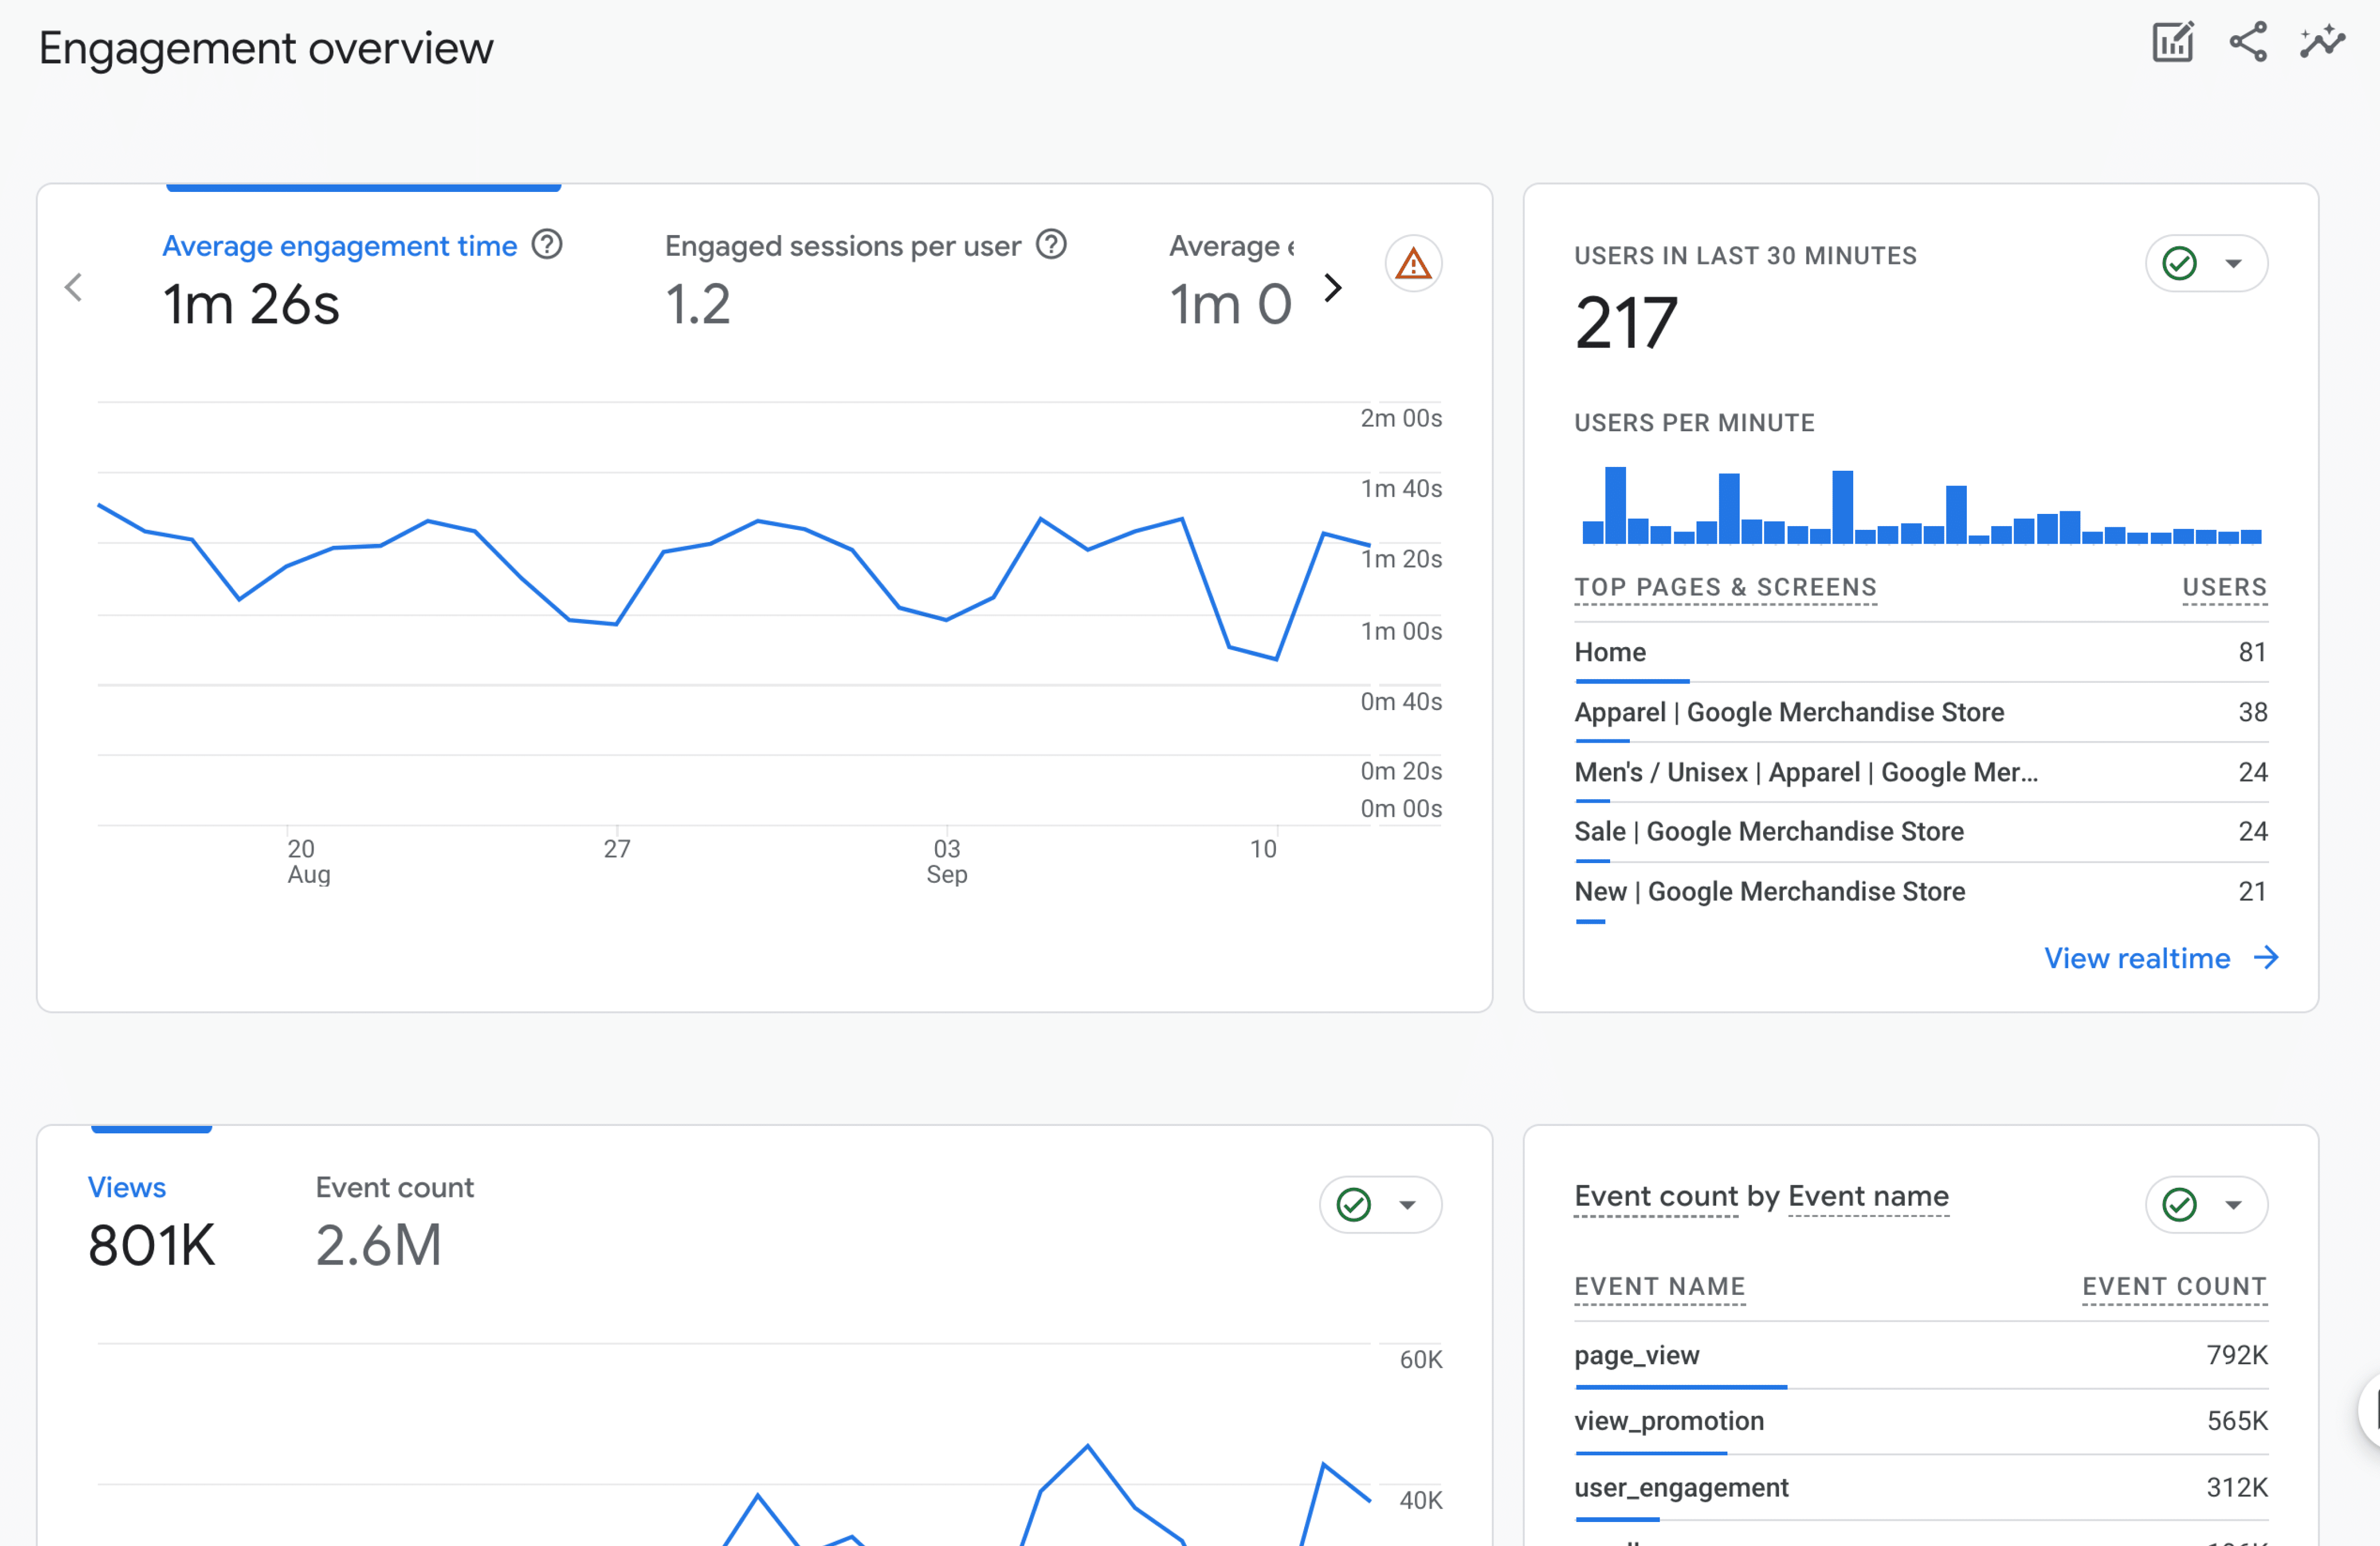
As with most of the reports, the Overview is a collection of data to be viewed at a glance. Here you will find data about “user stickiness”. This is a ratio of the daily vs monthly activity of users. This means if the report shows 100%, users are on your site daily.
The Events report shows a list of all your events. This will likely be the most viewed report now that everything in Google Analytics is tracked as an event. It can be a little confusing at first. For instance, if you want to check how many times a form has been viewed you need to click on form_impressions and then find the card Form ID to see the correct form. Viewing data this way isn’t the best way to get in-depth reports. Using the Explore section is best for that. More on that later.

Conversions show not just eCommerce conversions but any metric that you set to be tracked as a conversion. This is the new way to track goal conversions in Google Analytics.

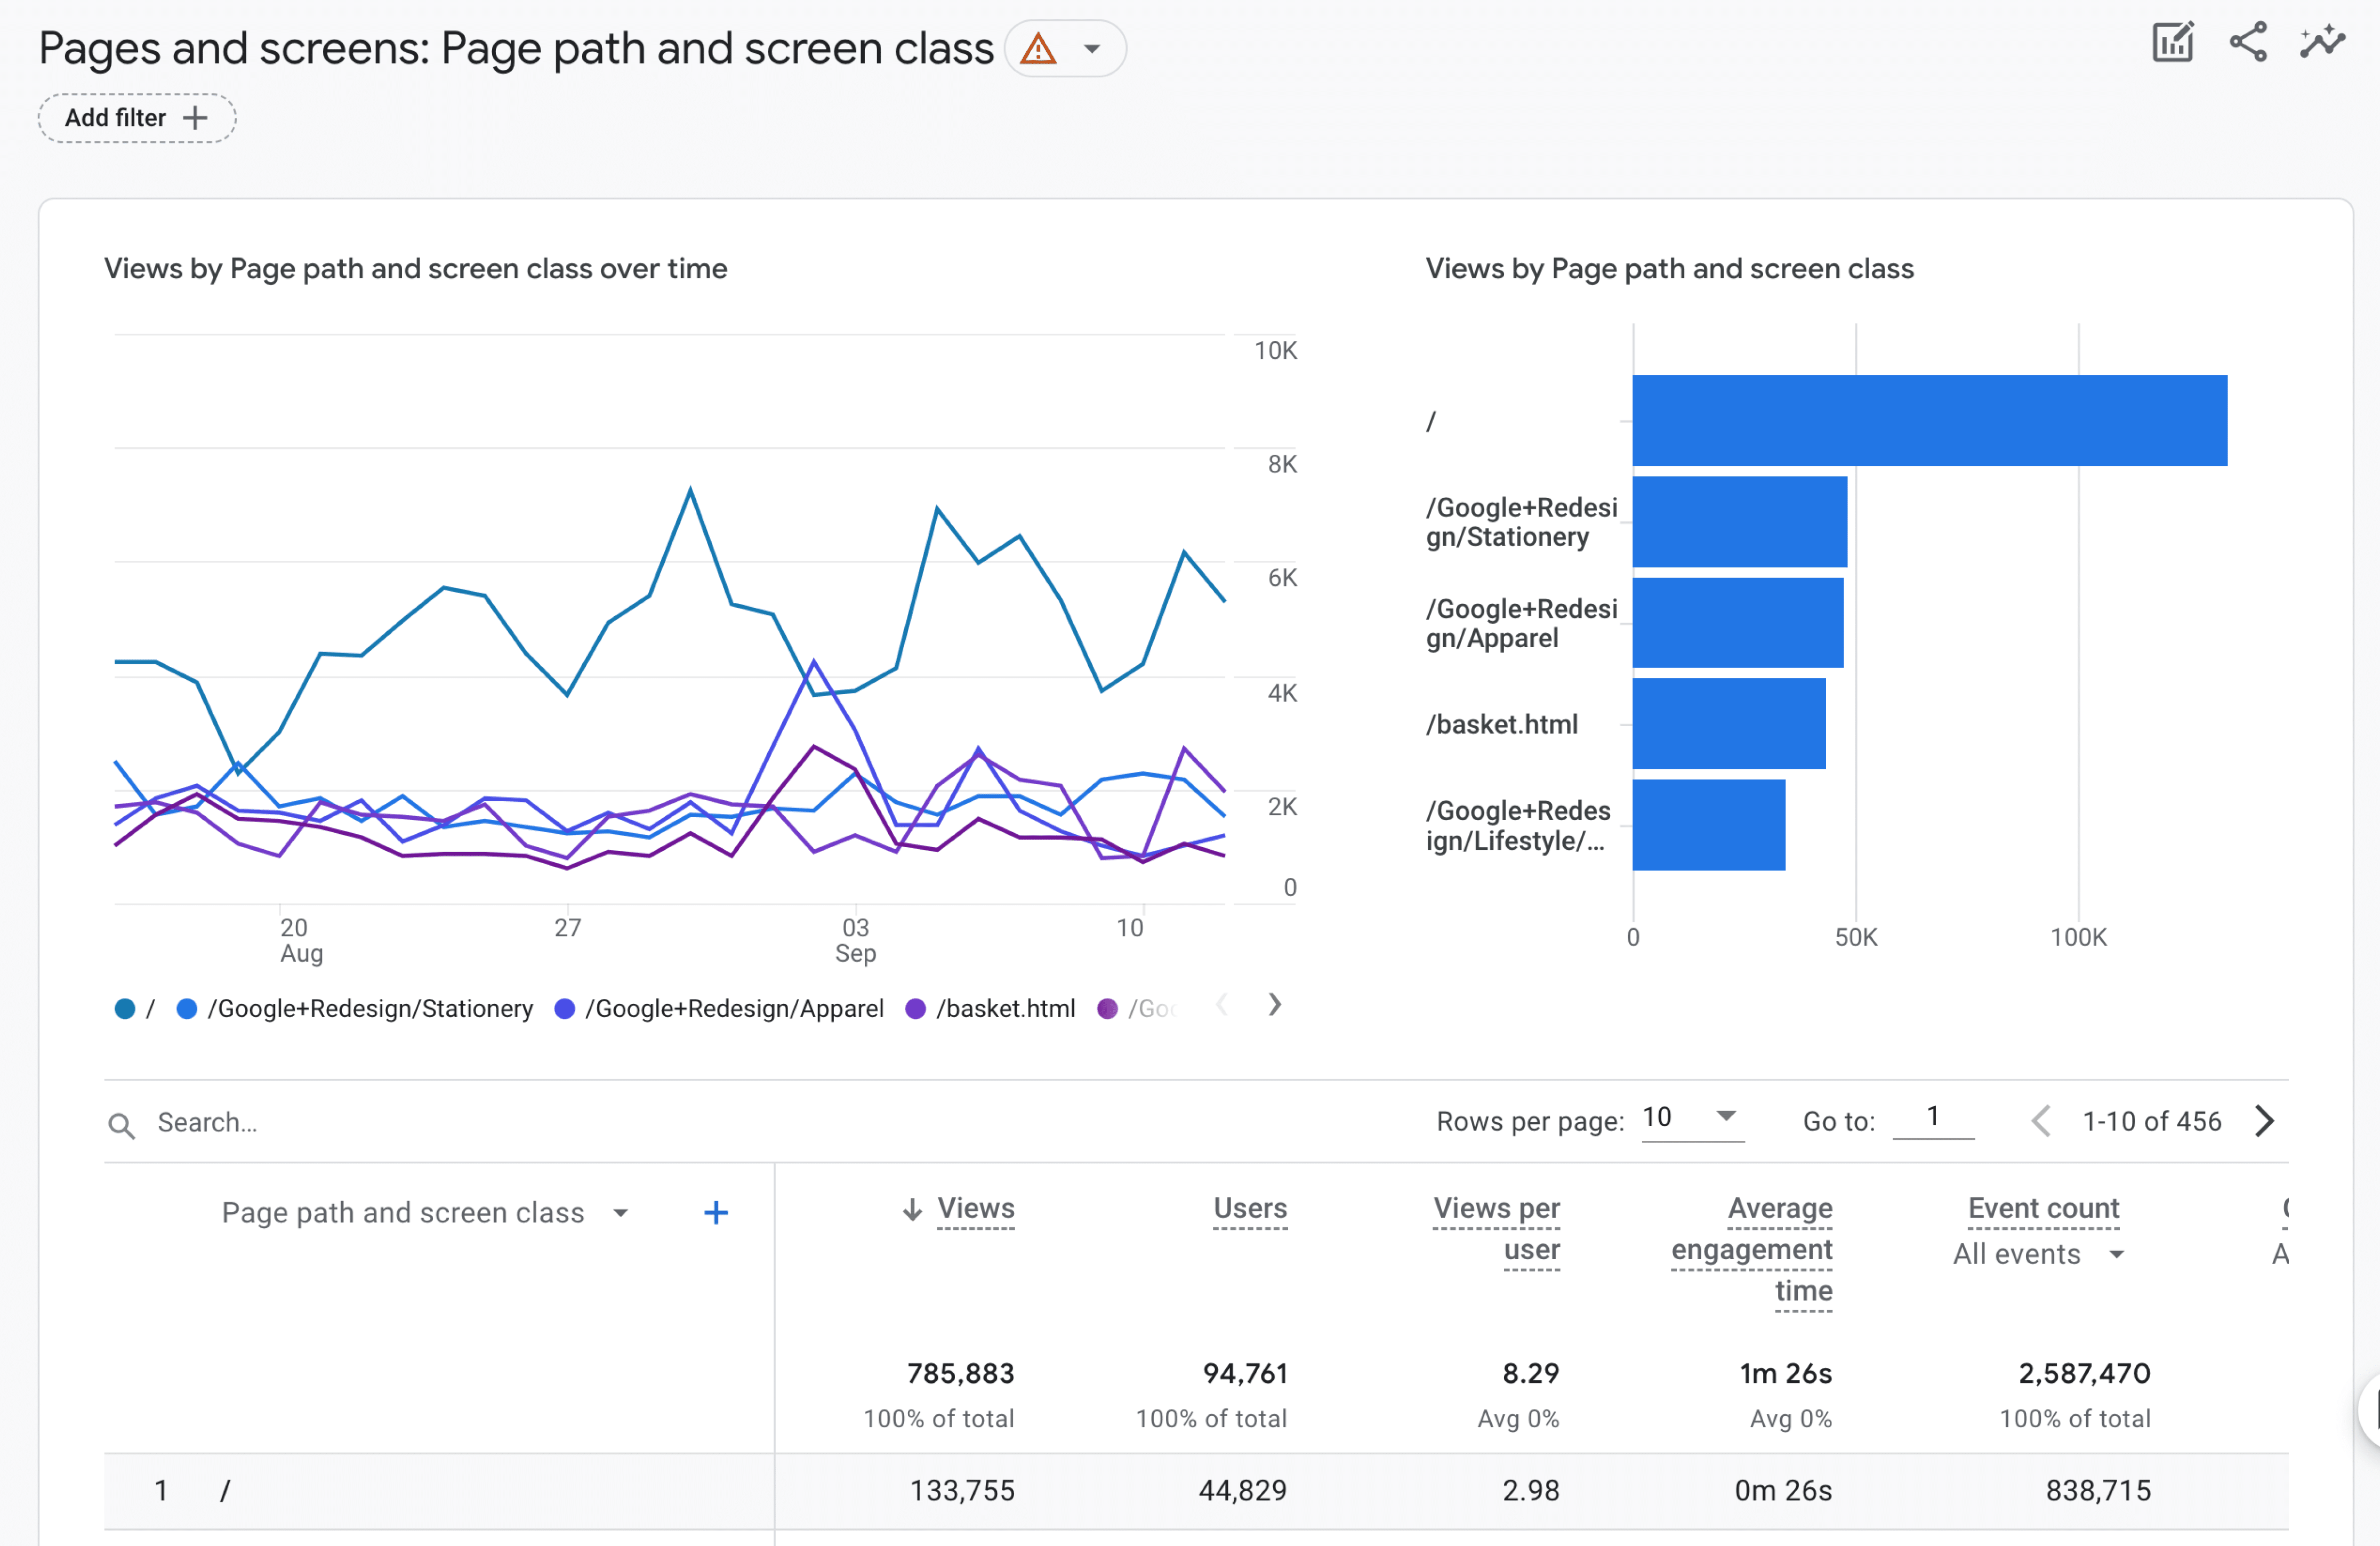
Next is Pages and screens. Here you will find all the data relating to your pages and posts. You will be able to see views, user count, average time on page, and even the conversions of that page.
The last report is the Landing page. Here you’ll see which pages site visitors land on first when they reach your website. If a session doesn’t have a page view hit, then the landing page dimension value will be (not set).

In the Monetization section of Google Analytics you will find these sub-reports:
- Overview
- Ecommerce purchases
- User purchase journey
- In-app purchases
- Publisher ads
- Promotions
The Monetization overview report will show you cards that give you a brief view of your orders. You can see coupons used, products by ID, and item names.

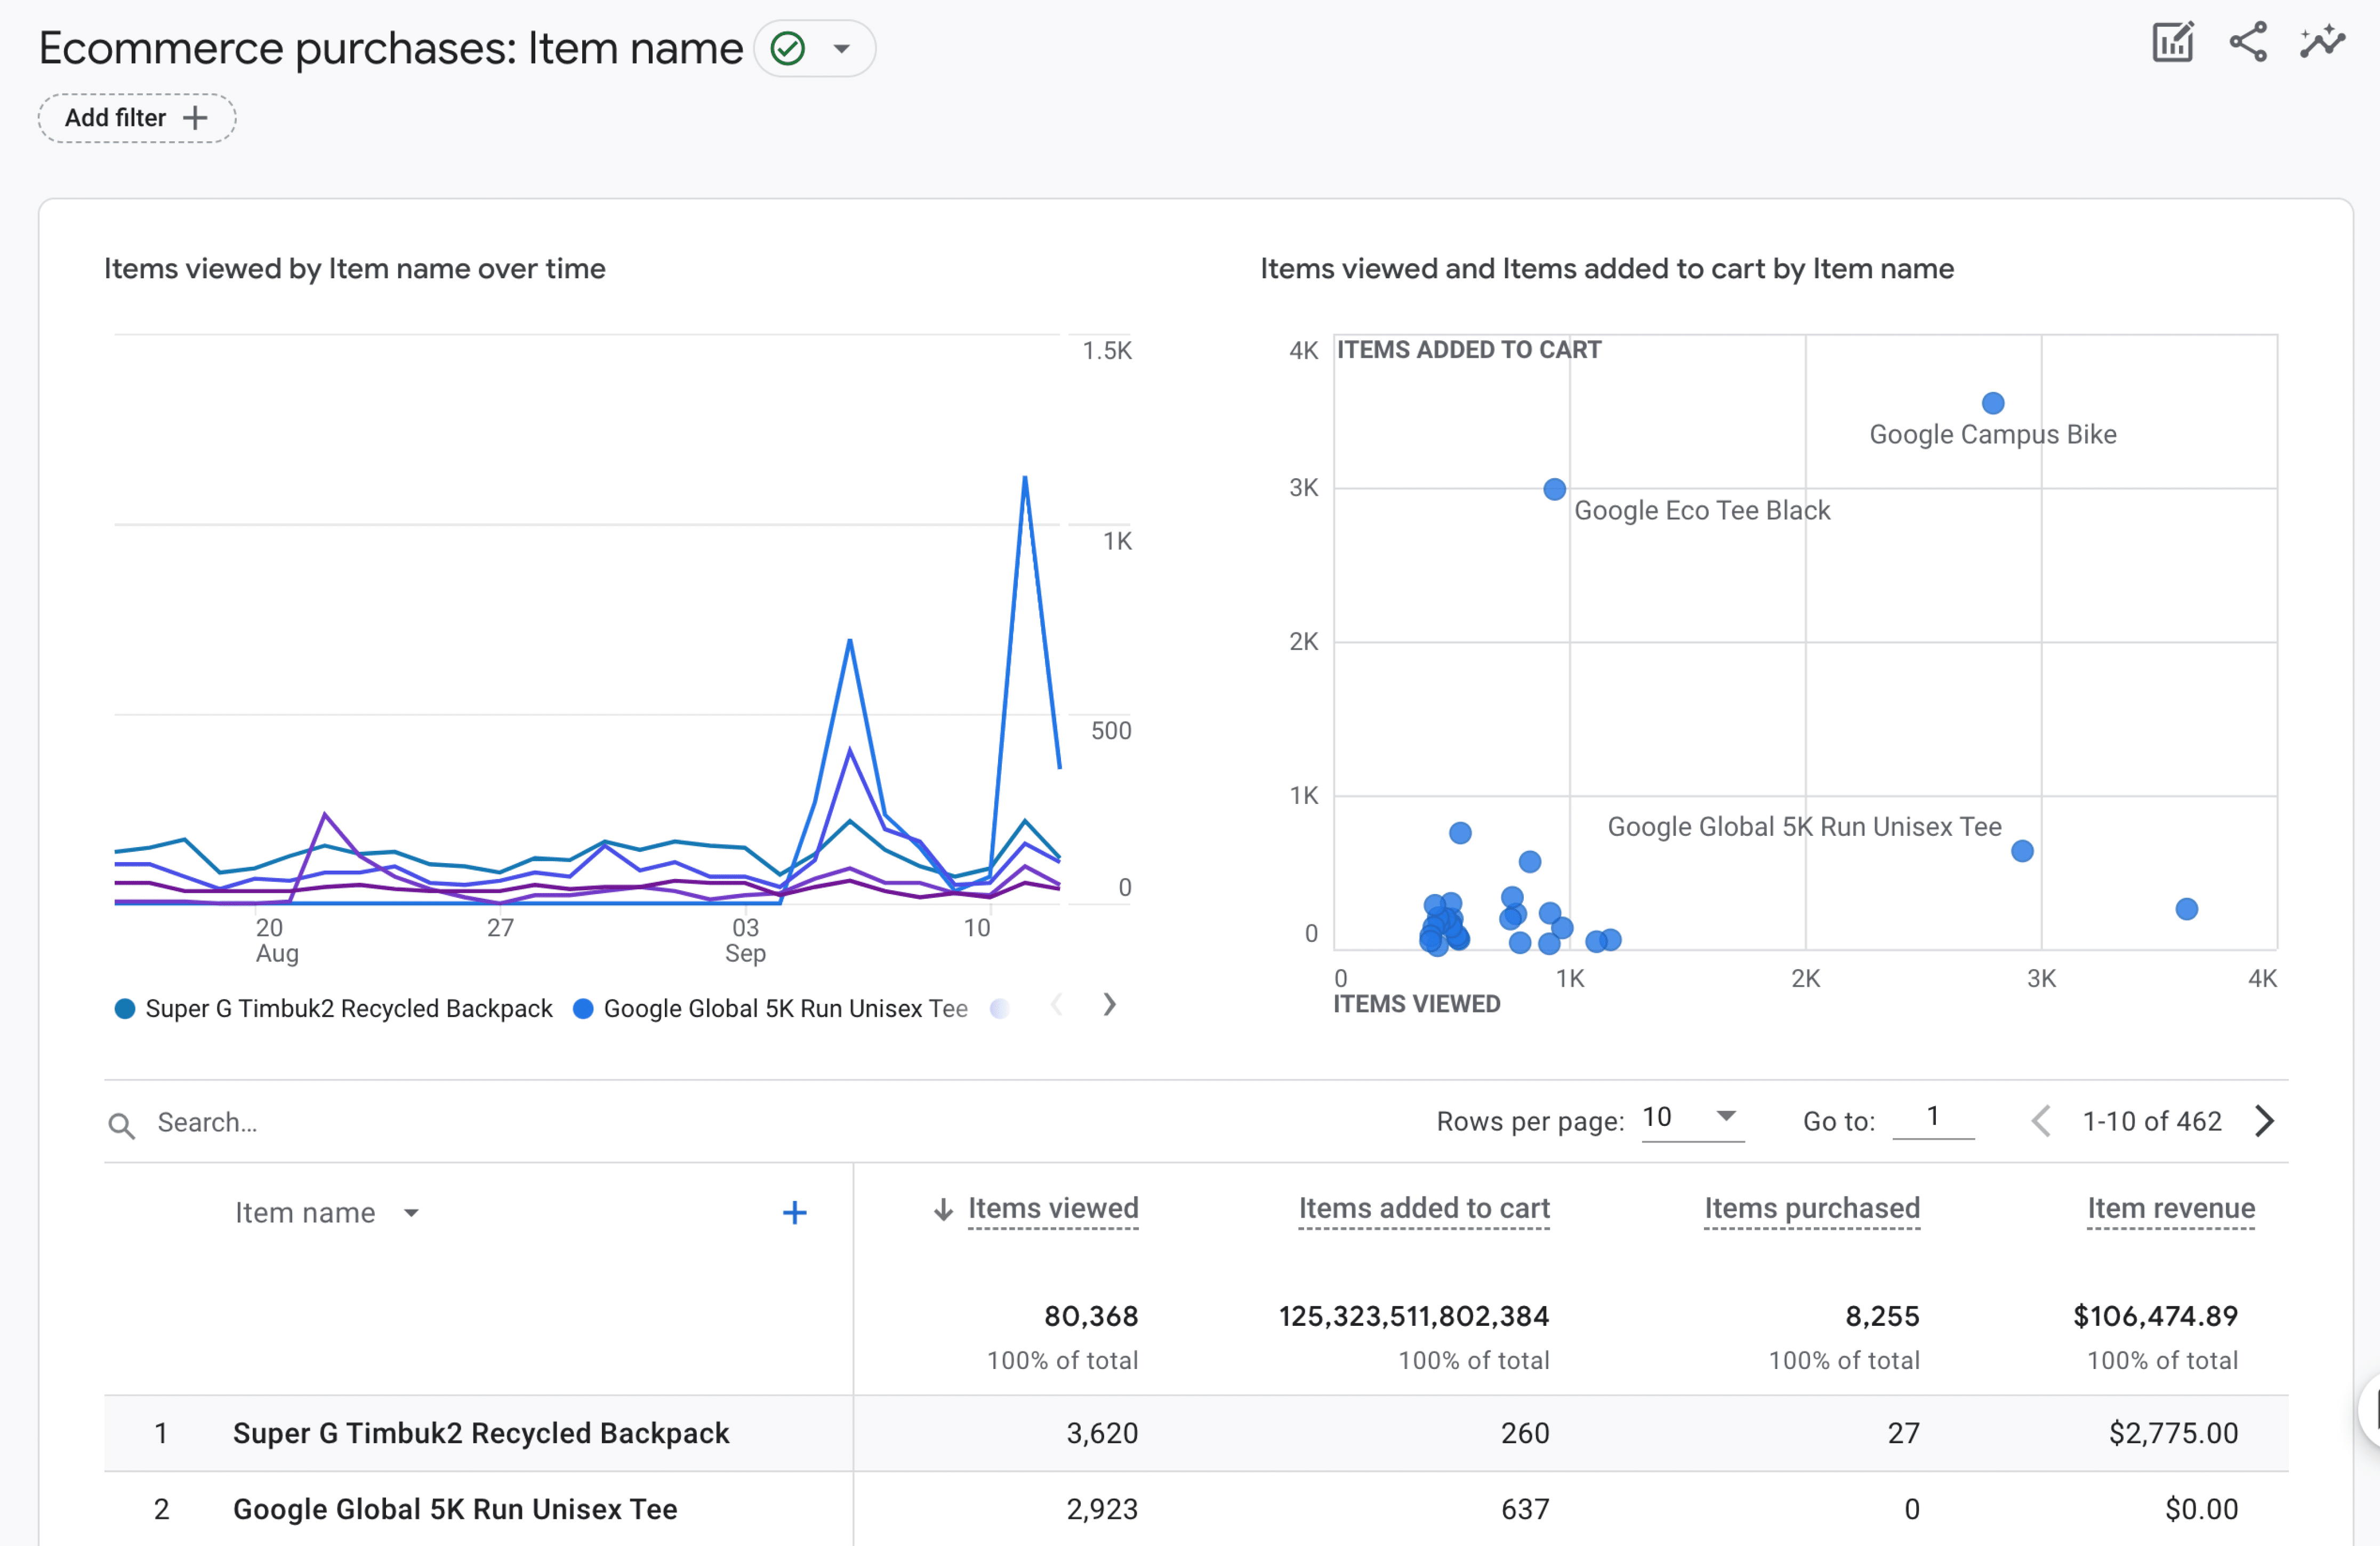
Ecommerce purchases will give you a better breakdown of your products and how they’re performing. This will show you views, add-to-carts, cart-to-view rate, eCommerce purchases, purchase-to-view rate, item purchase quantity, and item revenue. You can gain more insights into purchases by clicking on the blue + and adding another dimension to your report as well.
If your data stream is connected to a mobile app, then In-app purchases will generate an eCommerce report for that. Website data streams will not have anything in this report.
The Publisher ads report will also only show data if you’re using a mobile app. This will show ads data for mobile applications only.
The User purchase journey allows you see at which step site visitors are abandoning the purchase funnel.

The Promotions report allows you see how well your promotional incentives are performing and contributing to your purchases.

With no sub-reports, we next have the Retention report. This report contains New vs Returning visitors as well as retention and engagement.

The Demographics reporting section has three sub-reports:
- Overview
- Demographic details
- Audiences
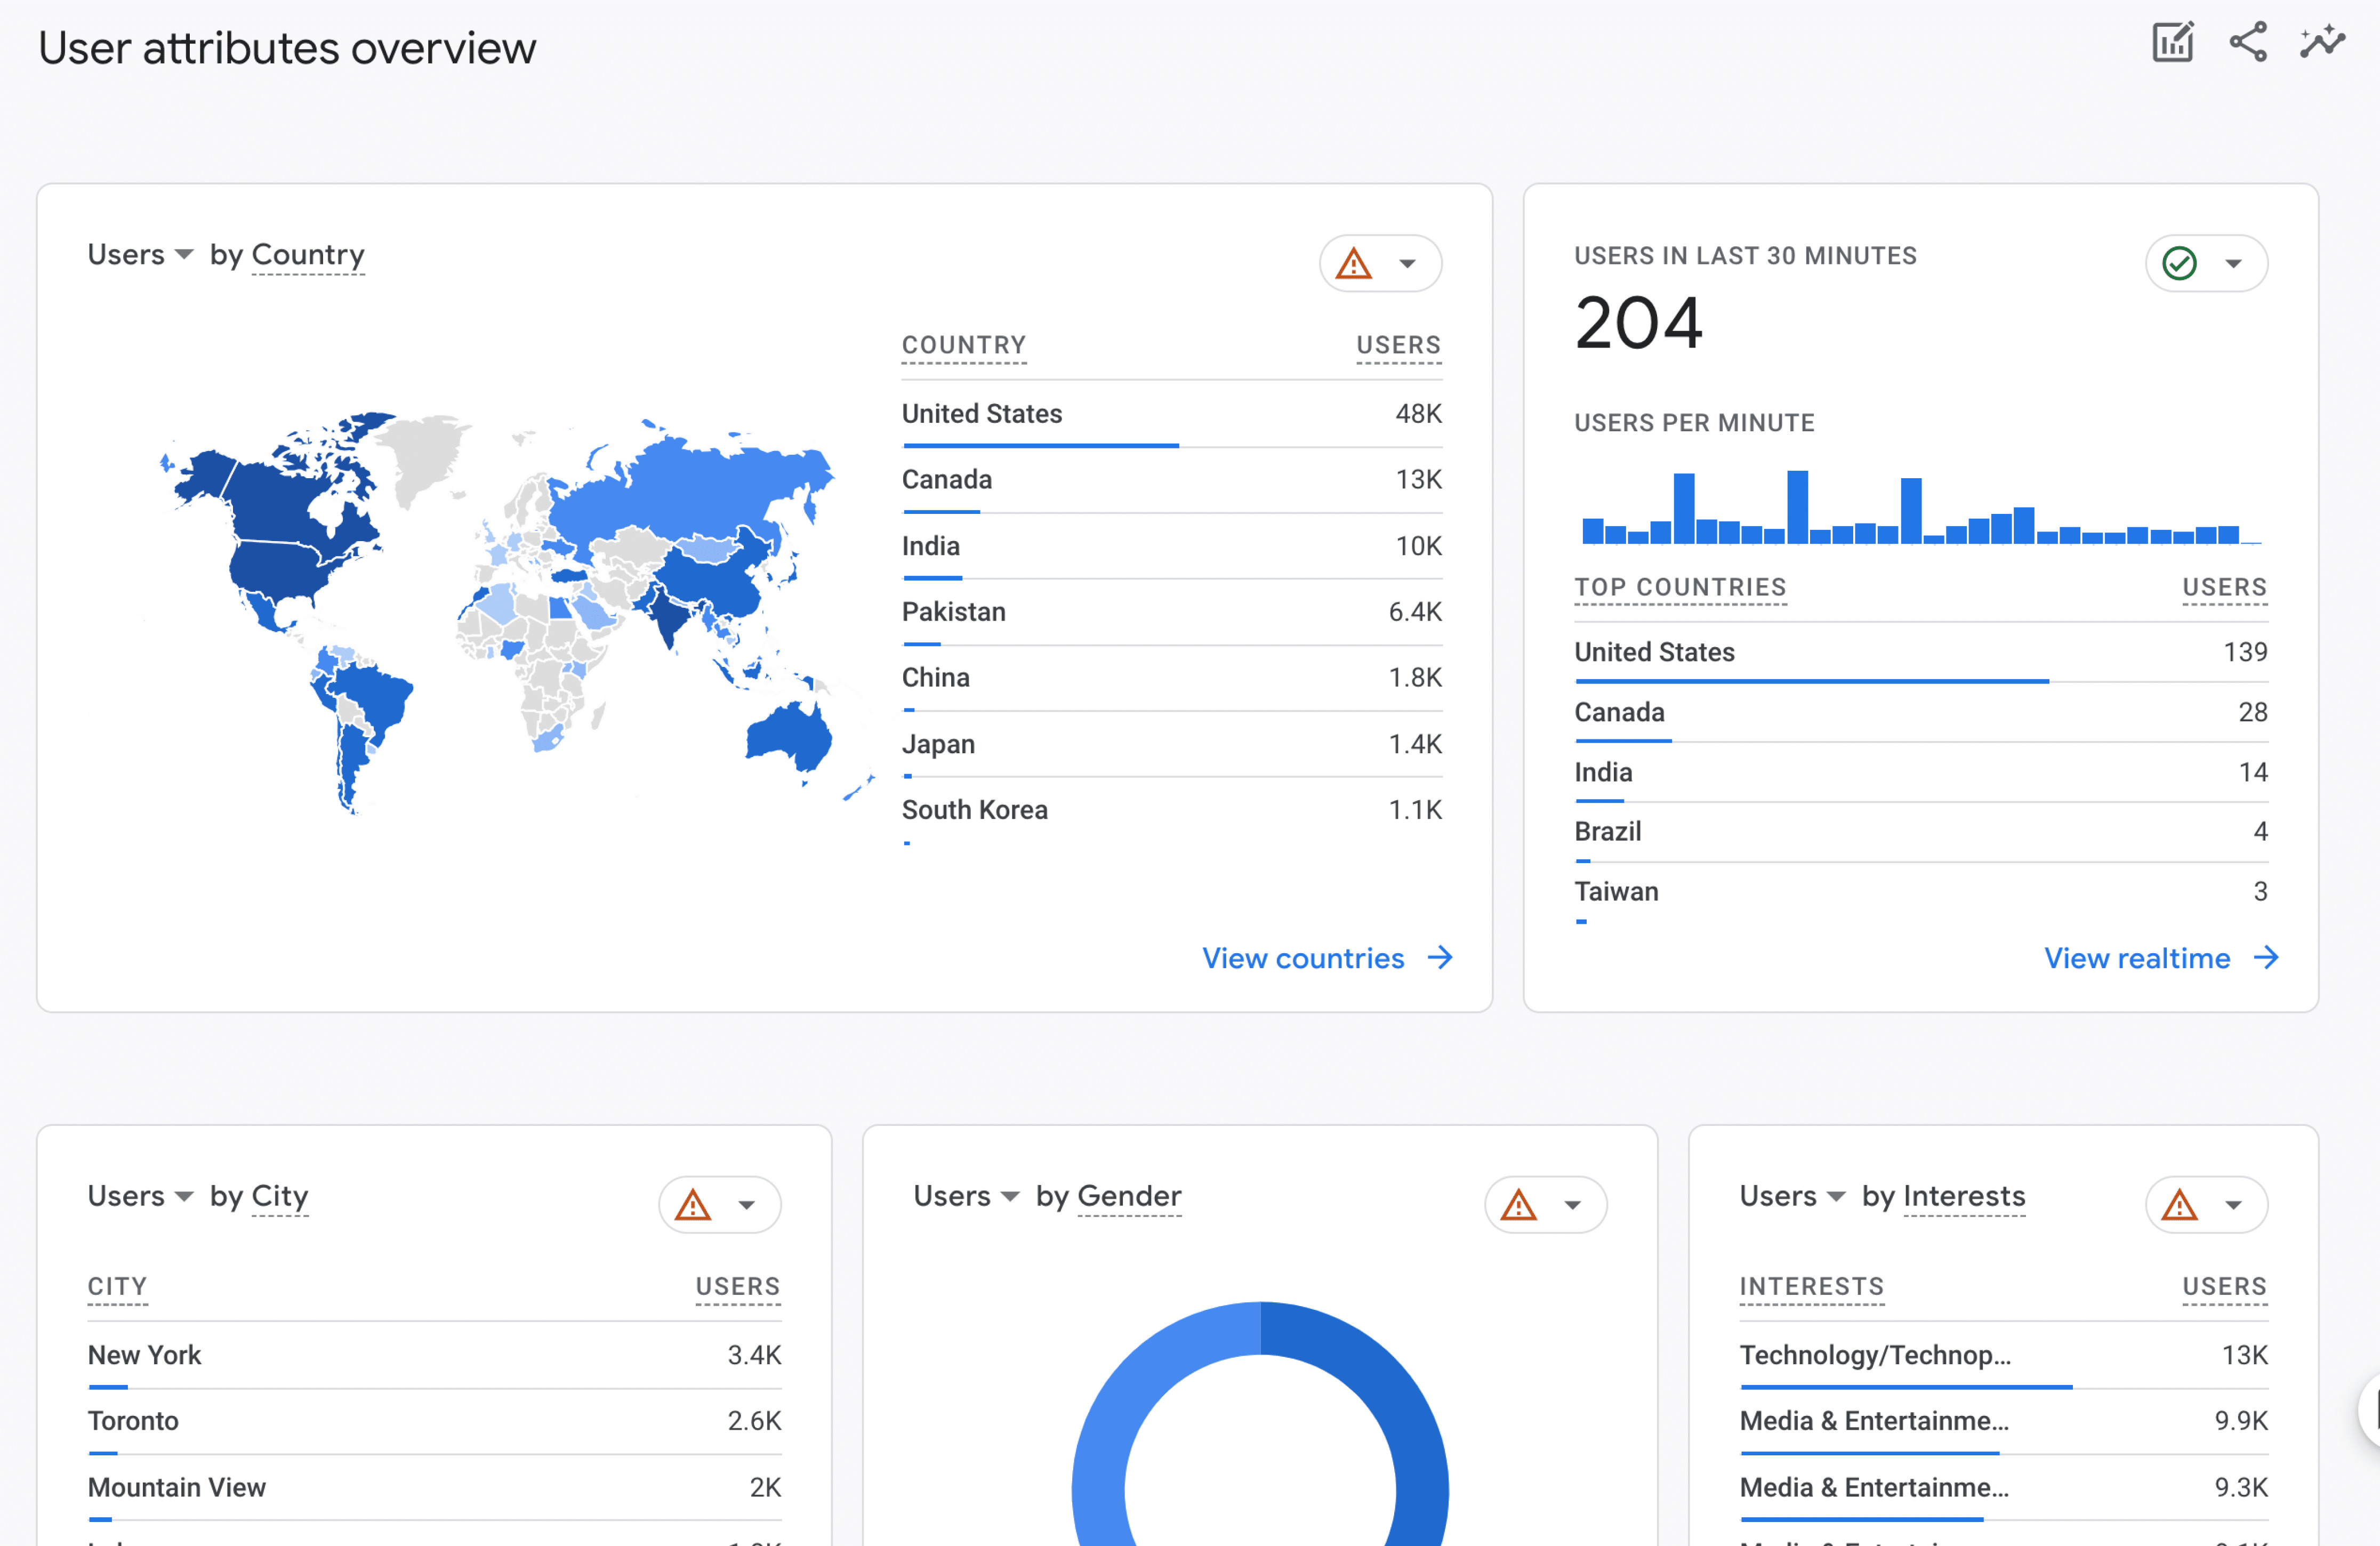
In the Demographic overview, you can find users country, active users in the last 30 minutes, city, gender, interests, age, and language. You can expand on these by clicking the link in the bottom right of the card view.
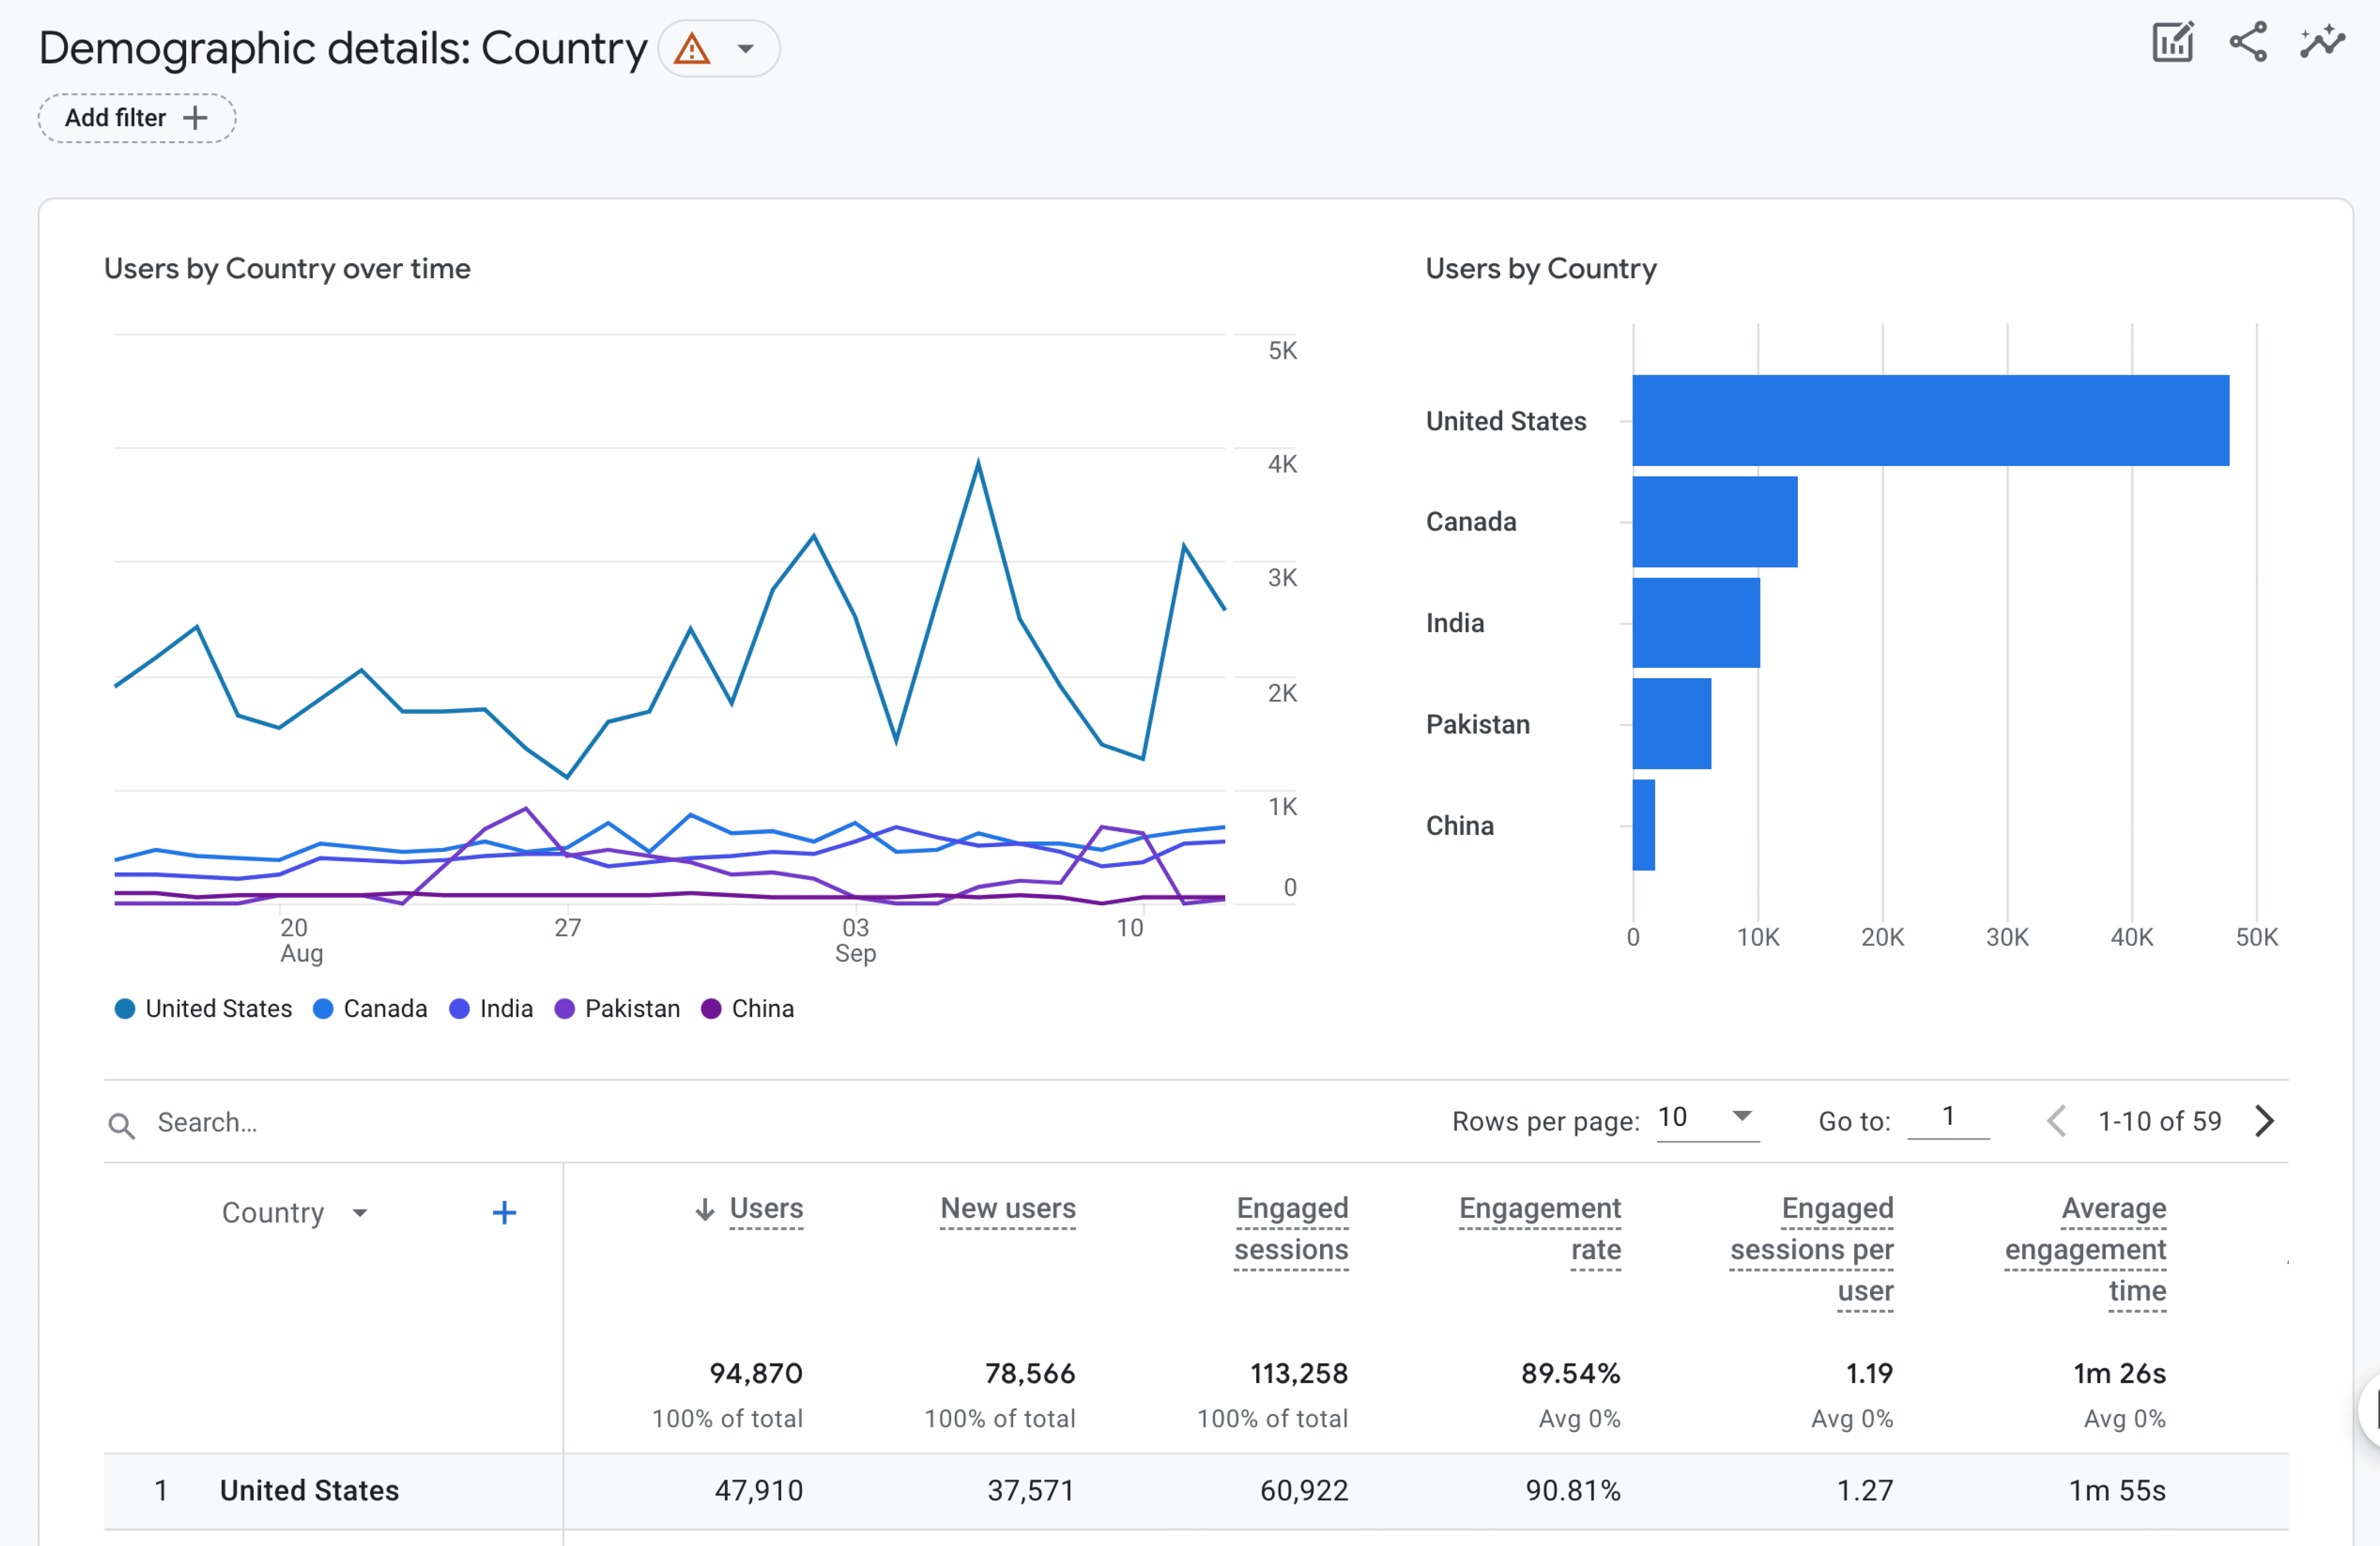
The Demographic details report will give you just that. More details. Here you will find a larger breakdown of data by country. Like other reports, you can click the blue + and add another dimension.
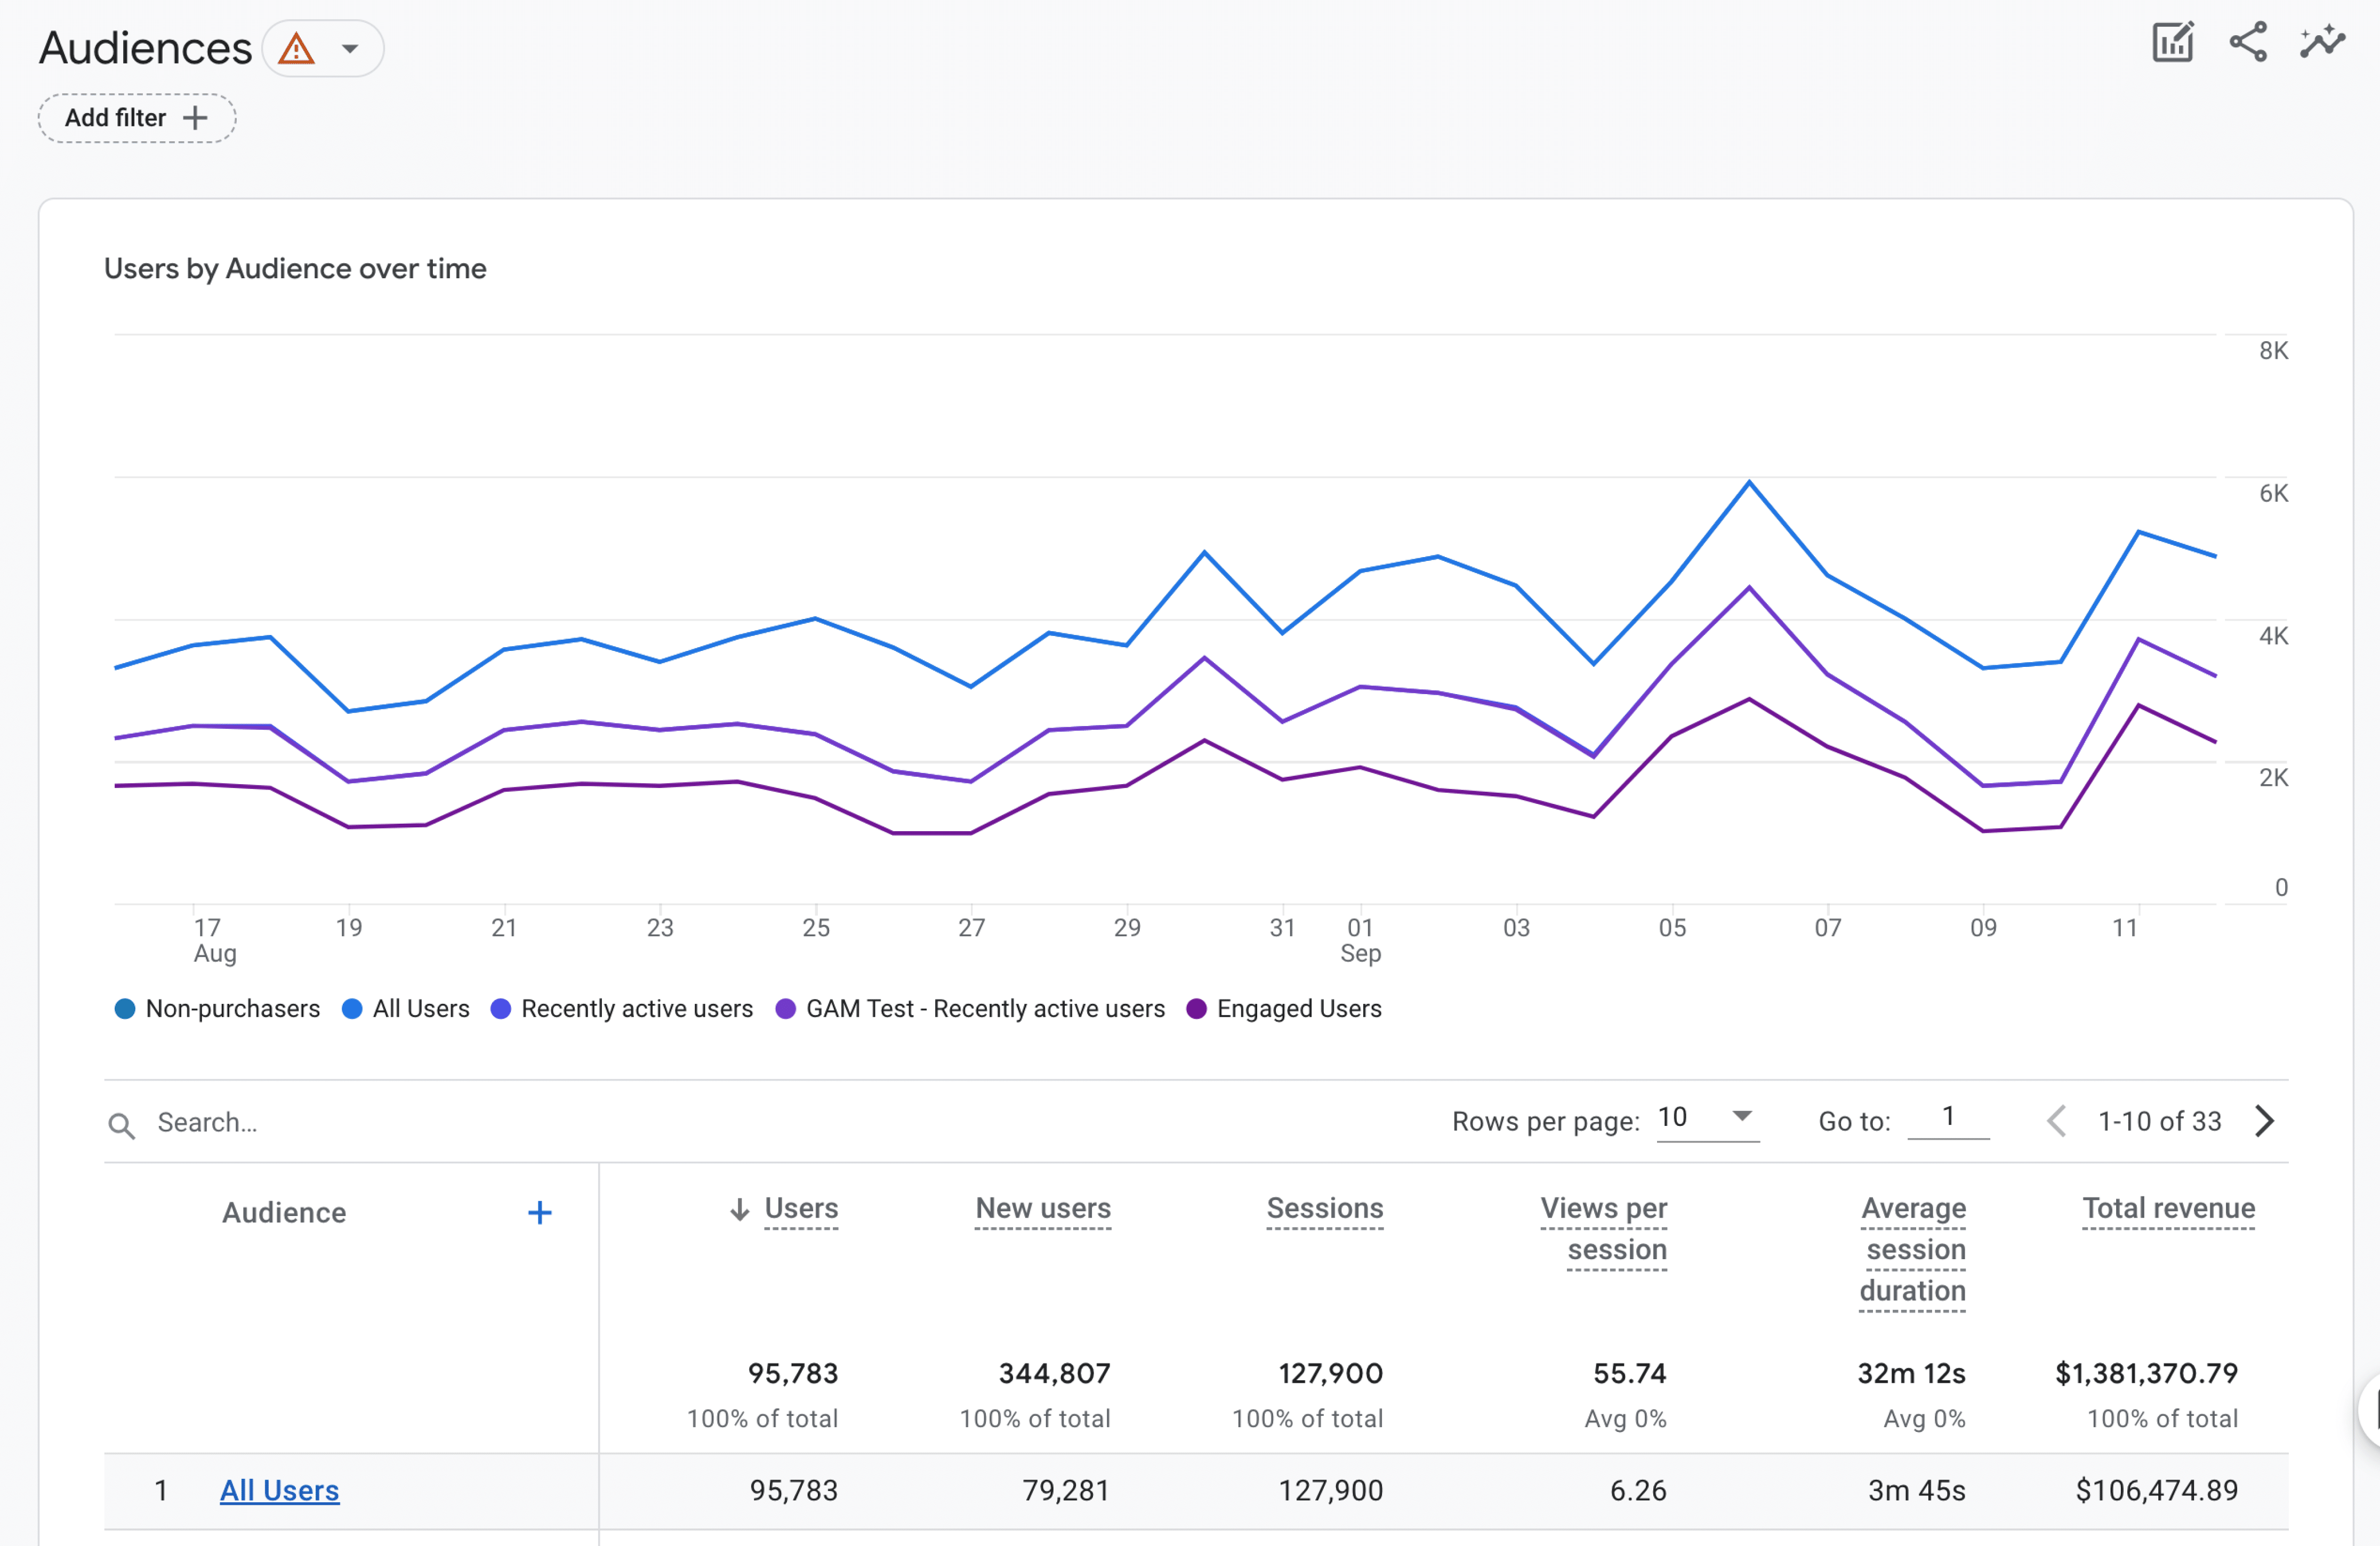
The Audiences report will help you see the most engaged or profitable audiences, that has at least 1 user in the time period.
The Tech report section also has two sub-reports:
- Overview
- Tech details
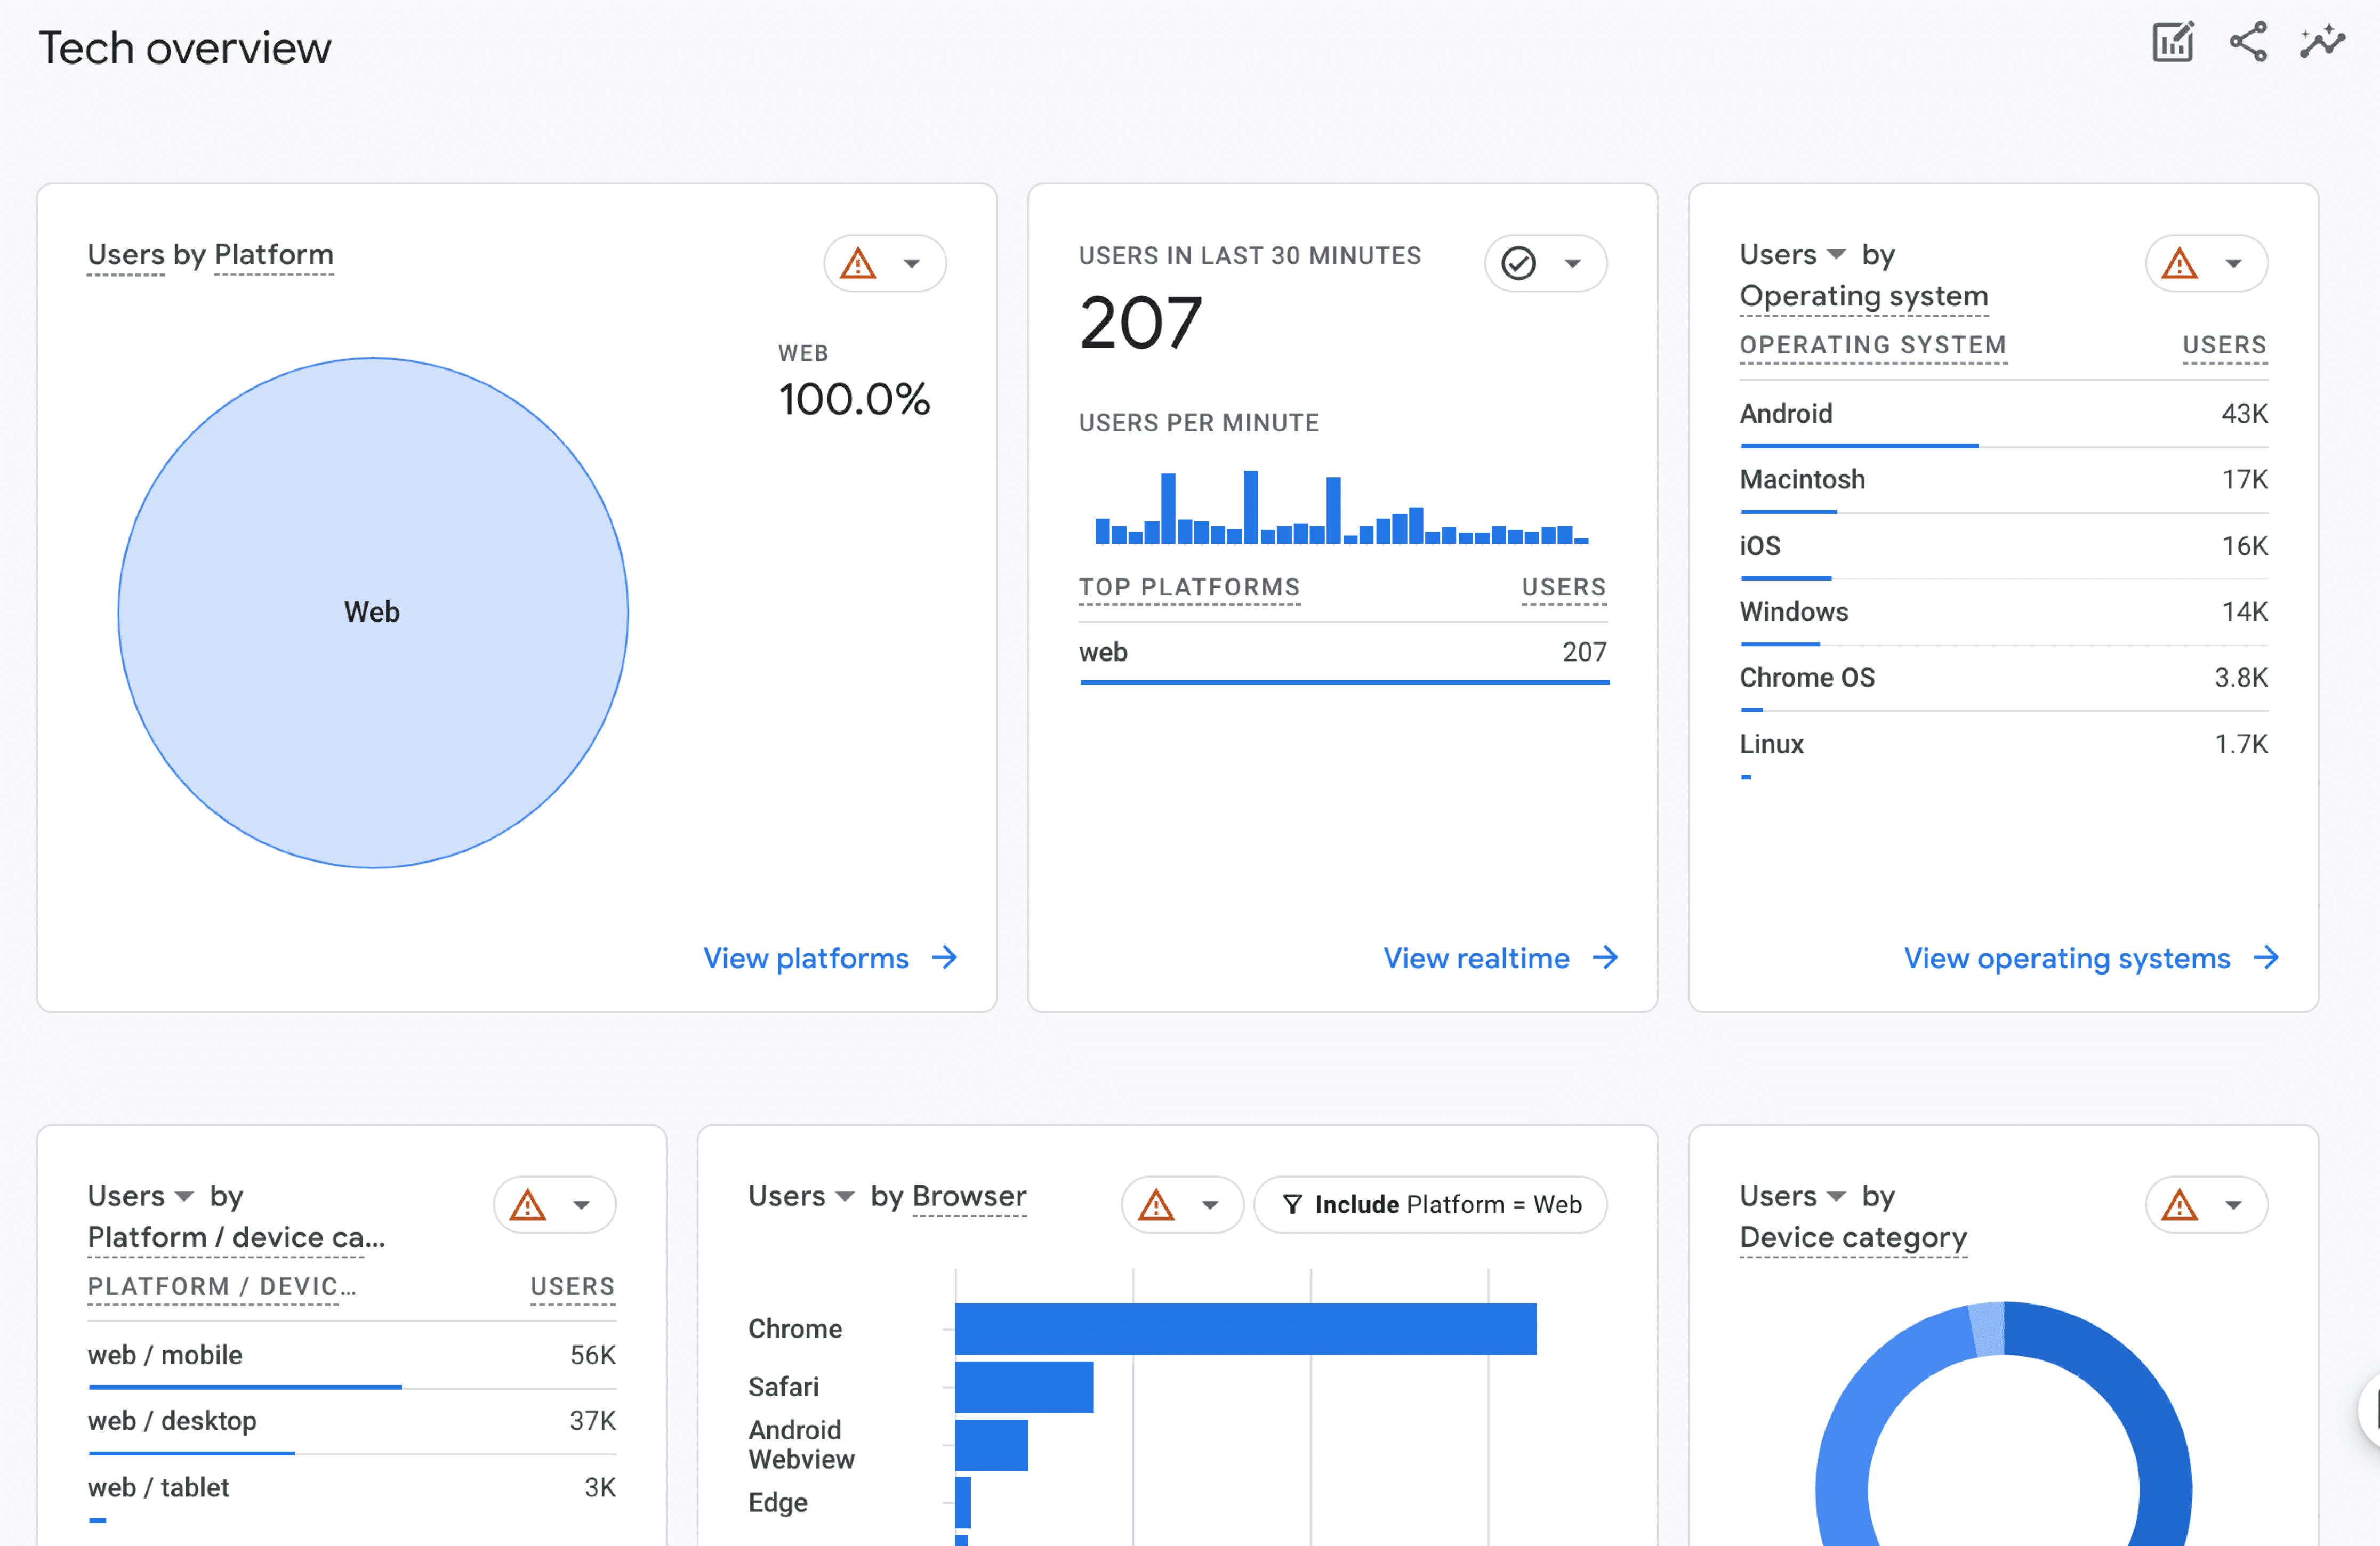
With the Tech overview report, you can see what types of devices and browsers were used to interact with your website or mobile app. You can click on any link in the bottom right of the cards to see more details.
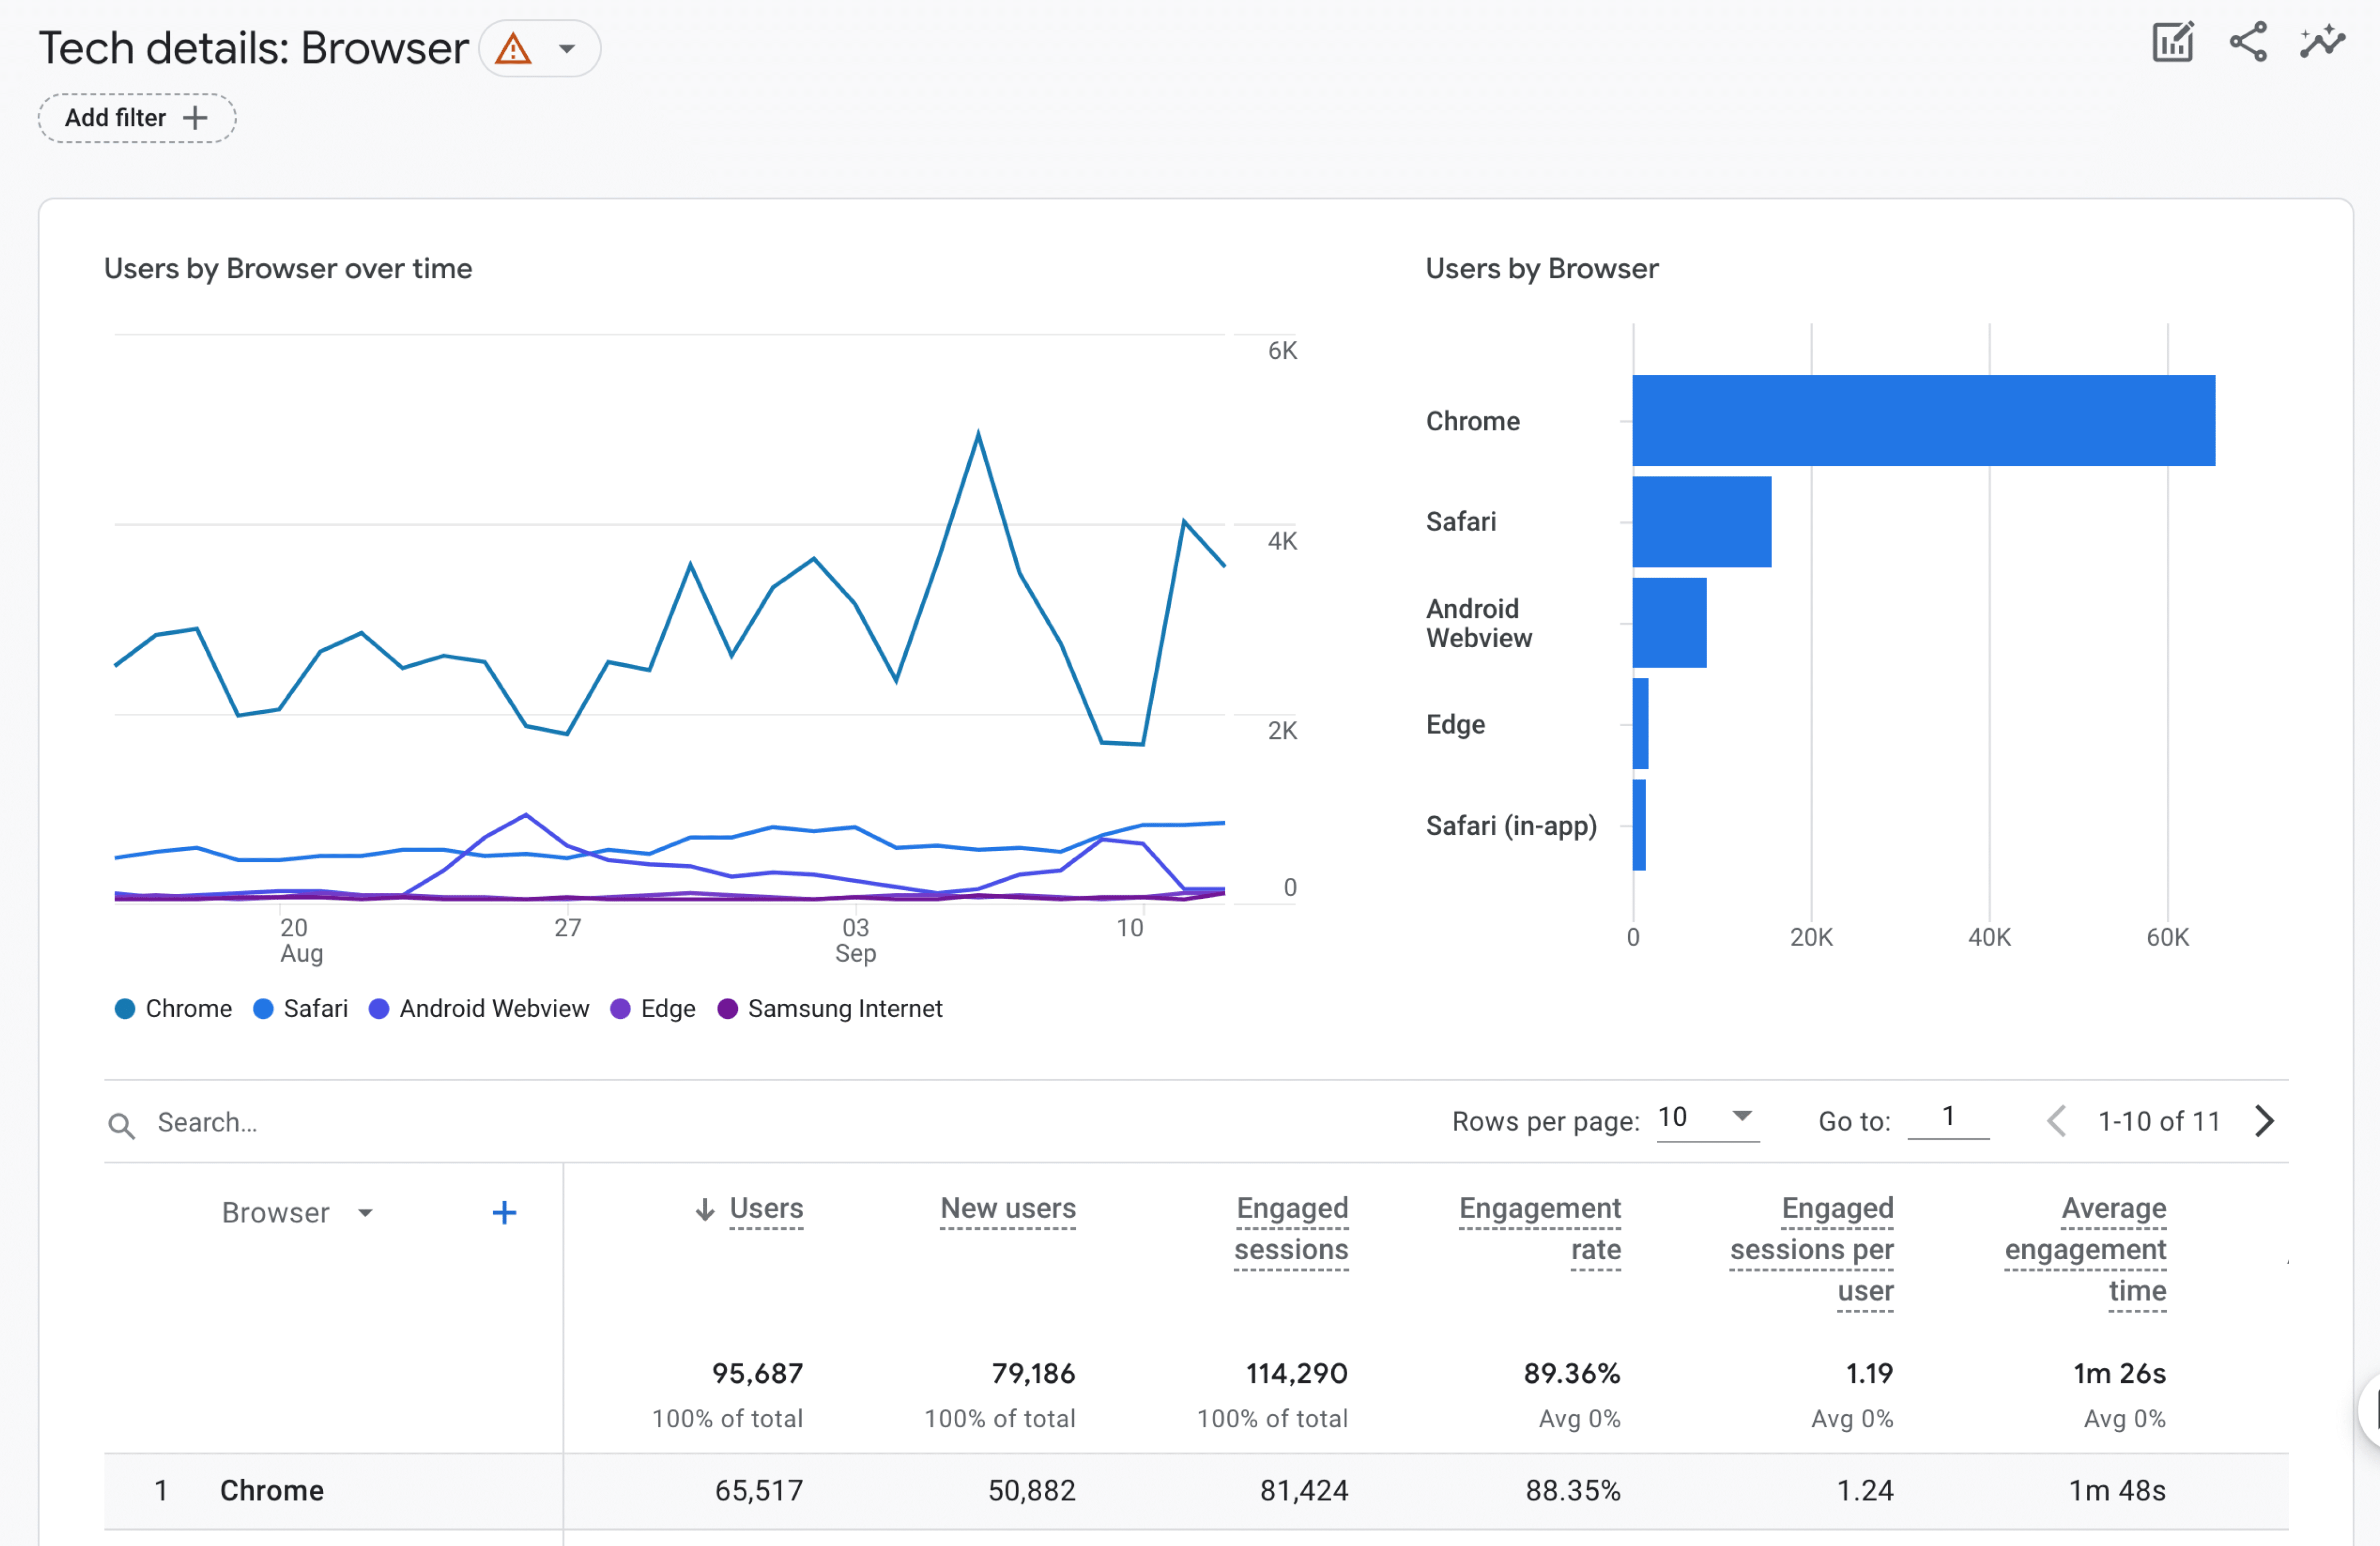
Tech details give you a better breakdown of the browsers used as well as allow you to add more dimensions with the blue + icon.
Introduction to Google Analytics Explore
The Explore section of Google Analytics is where users really take control of their detailed reports. However, you will have to spend some time getting used to creating them. Once you do you will be able to create all kinds of detailed reports that can help you make the best decisions for your business.
There are four types of reports to choose from when creating a new one:
- Blank
- Free form
- Funnel exploration
- Path exploration
- Segment overlap
- User explorer
- Cohort exploration
- User lifetime
Each of these forms displays data in a different way visually. Inside each form, you can change this in the Tab Settings using the Technique dropdown menu. It’s also important to note the Date Range will stay set to whatever dates you pick and will need to be updated when you view the report each time to the correct dates you wish to see data for.

Introduction to Google Analytics Advertising
This section of Google Analytics is where you will get all of your reports for your Google Ads account within the following sub-reports:
- All channels (Performance)
- Model comparison
- Conversion paths
Performance » All channels shows which channels or campaigns attributed to conversions.

Model comparison is a very interesting new feature that comes with Google Analytics. Here you can view the differences between different attribution models. You can learn more about selecting your attribution models here.

Conversion paths are a way to see how different attribution models contribute to each path.

Configure your Google Analytics property
To change settings for tracking and add custom events, you can go to the Admin and manage the following:
- Events
- Conversions
- Audiences
- Custom definitions
- DebugView

Everything in Google Analytics is tracked as an event now. In the Events section, you will find all the events that have been created for tracking. Creating and managing events can be rather complex and would take a whole article to explain. Luckily, you can check out Loves Data’s article about events to get started.

The next section is Conversions. The name can be a little misleading as it doesn’t just deal with eCommerce events. In GA4 you can set any of your events as conversions. This means in your event’s menu, you can toggle an event to be tracked as a conversion. You can read more about that here.

Audiences allow you to separate your traffic into specific conditions. People who have made a purchase, those who haven’t, or users who spent a certain amount of time on a page. You can then use these audiences in your custom reports in the explore section.

Create custom dimensions and metrics in Custom definitions. You can learn more about getting started with custom definitions here.

The last section is DebugView and serves the purpose of allowing you to test data in real-time without having to inflate your actual data. No data is recorded in your account outside of the DebugView. You can test data from the web or mobile. Depending on which you use, will depend on the tools you need to test with.

Now you know what Google Analytics does, why it’s so vital to websites, and how MonsterInsights make it easy to get even its most advanced features set up on your site.
Next, take a look at our guide to setting up Affiliate Link Tracking, or eCommerce.
