Are you looking to identify trends or measure the impact of changes to your WordPress site over time? In this guide, we’ll show you how to use MonsterInsights’s date comparison feature to easily view data across different periods.
Before getting started…
- You have a MonsterInsights Plus or higher license.
- You have installed the MonsterInsights plugin.
- You are connected to your Google Analytics account.
For a quick walk through, check out the video below.
Getting Started
By default, in MonsterInsights’s overview report you’ll see a month-over-month percentage, indicating an overall positive or negative trend of your website based on the number of sessions, page views, average session duration and bounce rate.

But for even more insights, you can enable MonsterInsights’s date comparison feature to identify the underlying factors driving the changes.
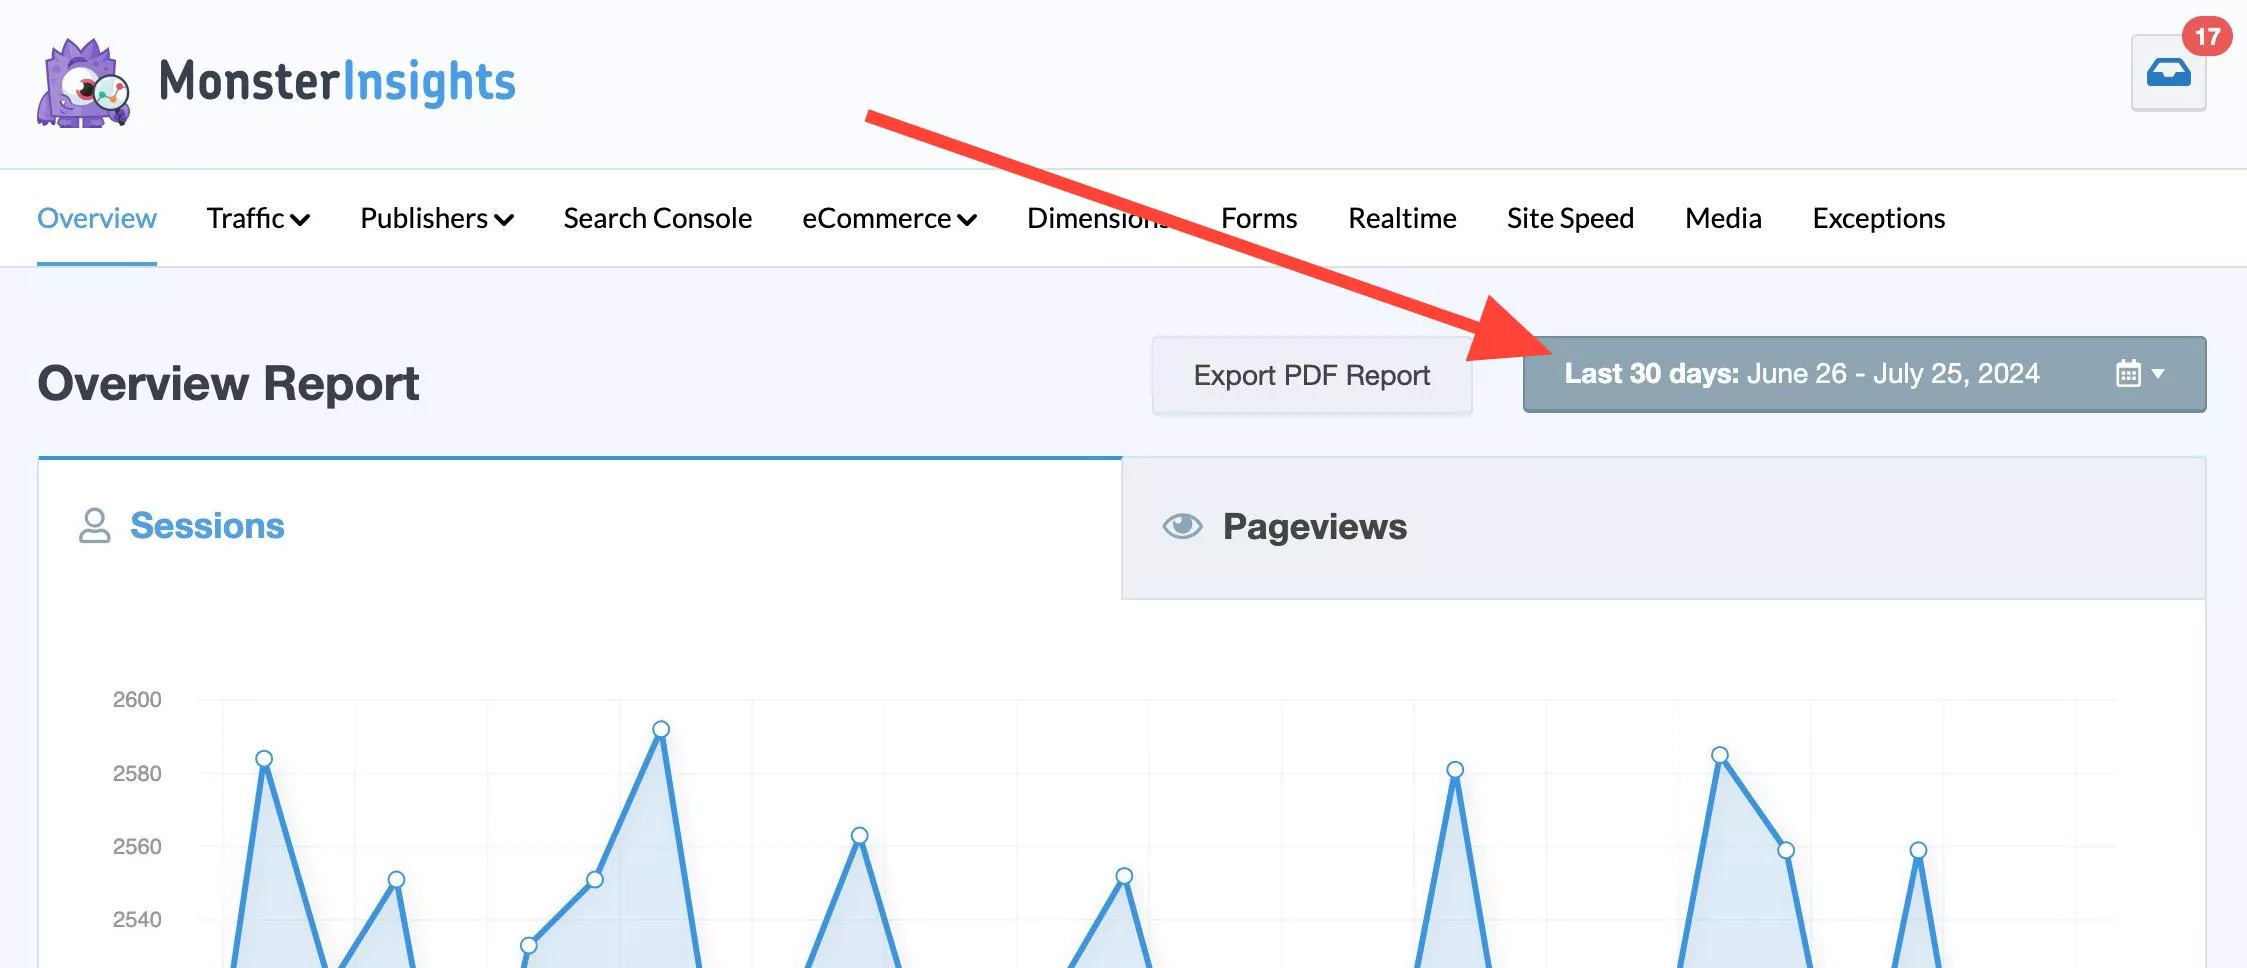
To start, first navigate to Insights » Reports. Then click on the date picker to view date range options for your reports.
Enable the Compare to Previous option.
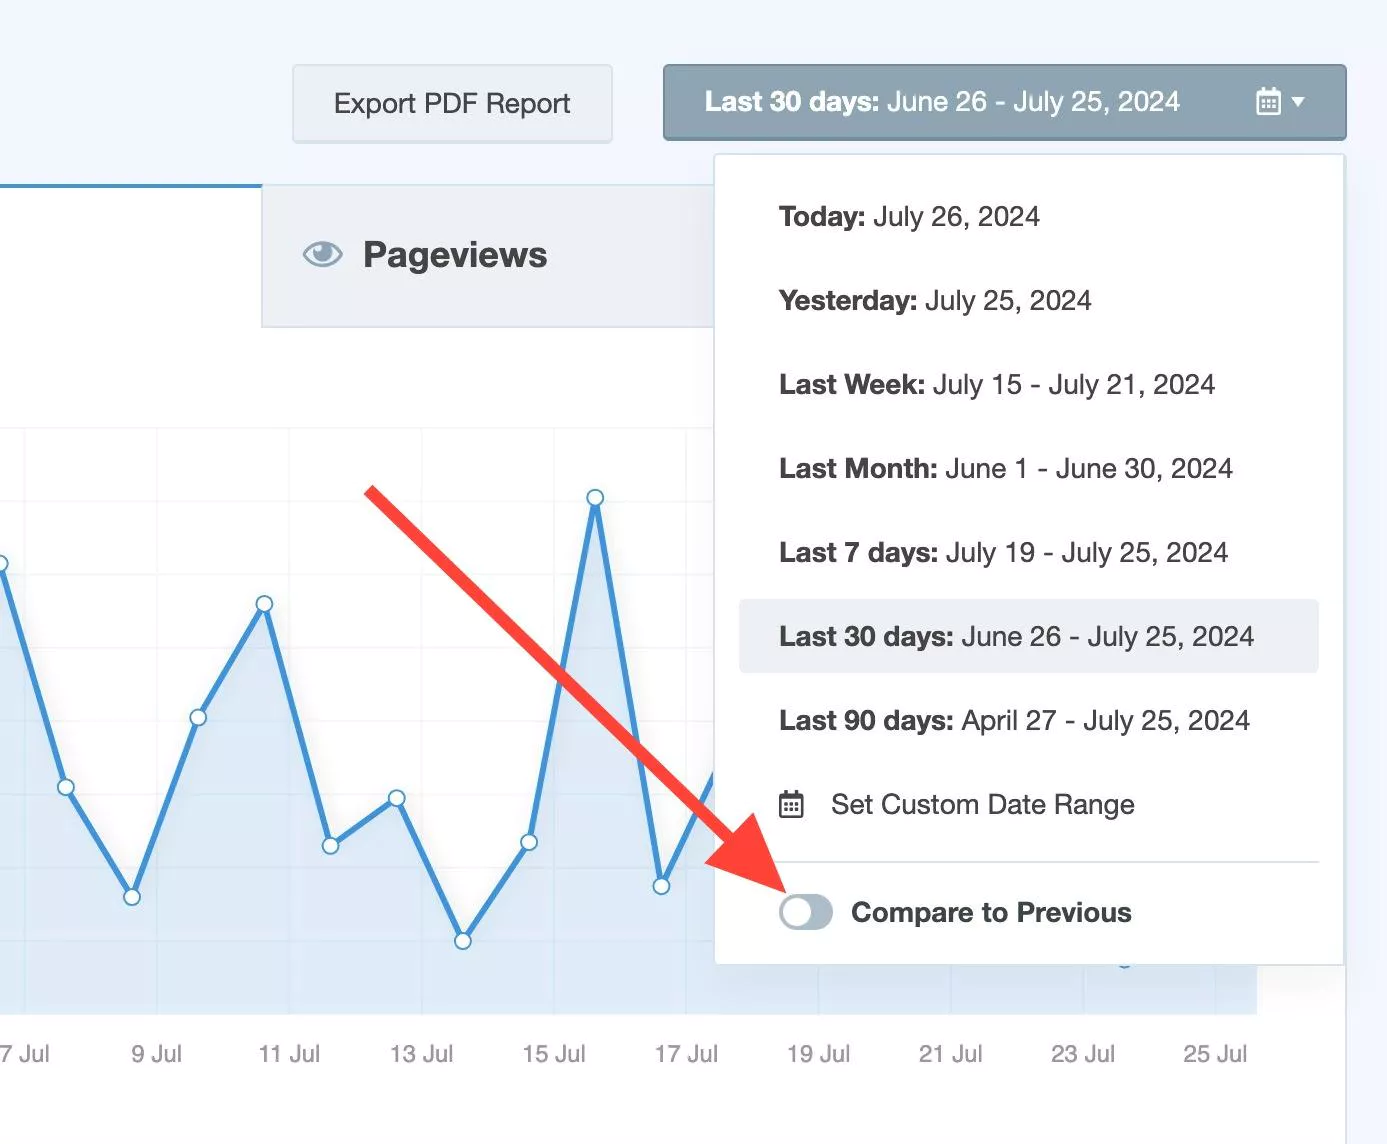
Once enabled, MonsterInsights reports will refresh and automatically display the data currently selected for that period (e.g the last 30 days, last week and etc), as well as the previous period data. You may adjust your date range as needed.
With this, you’re able to compare data in the following reports:
- Overview
- Traffic
- Publisher
- eCommerce
- Dimensions
- Forms
- Media
Once you navigate away from any of the above reports, the date comparison will disable automatically until enabled again.
How To Compare Data
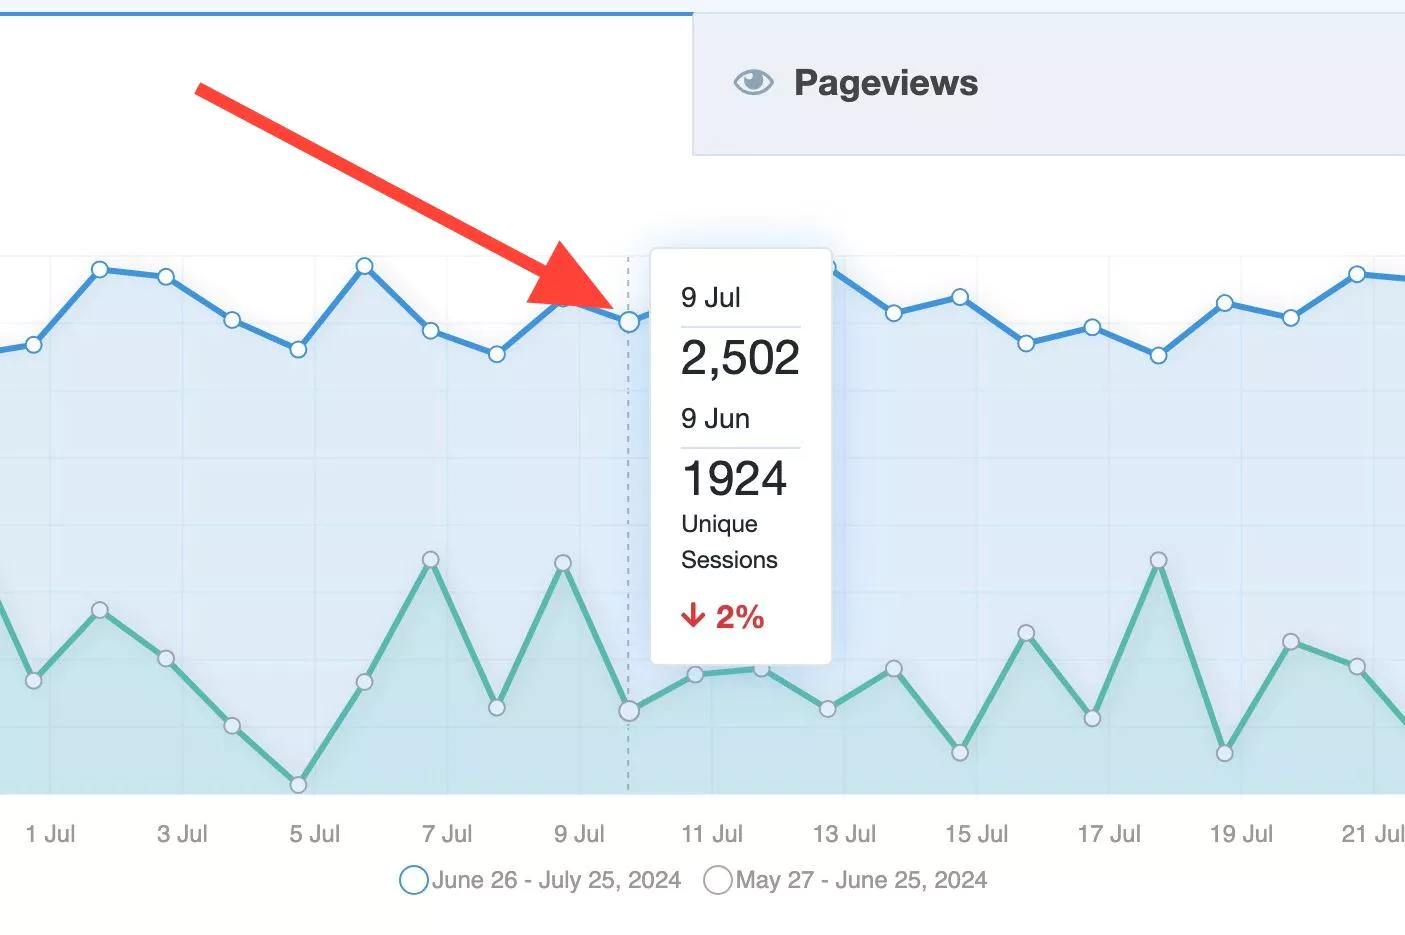
When viewing graphs, hover over a data point to view numbers of the current and previous date.
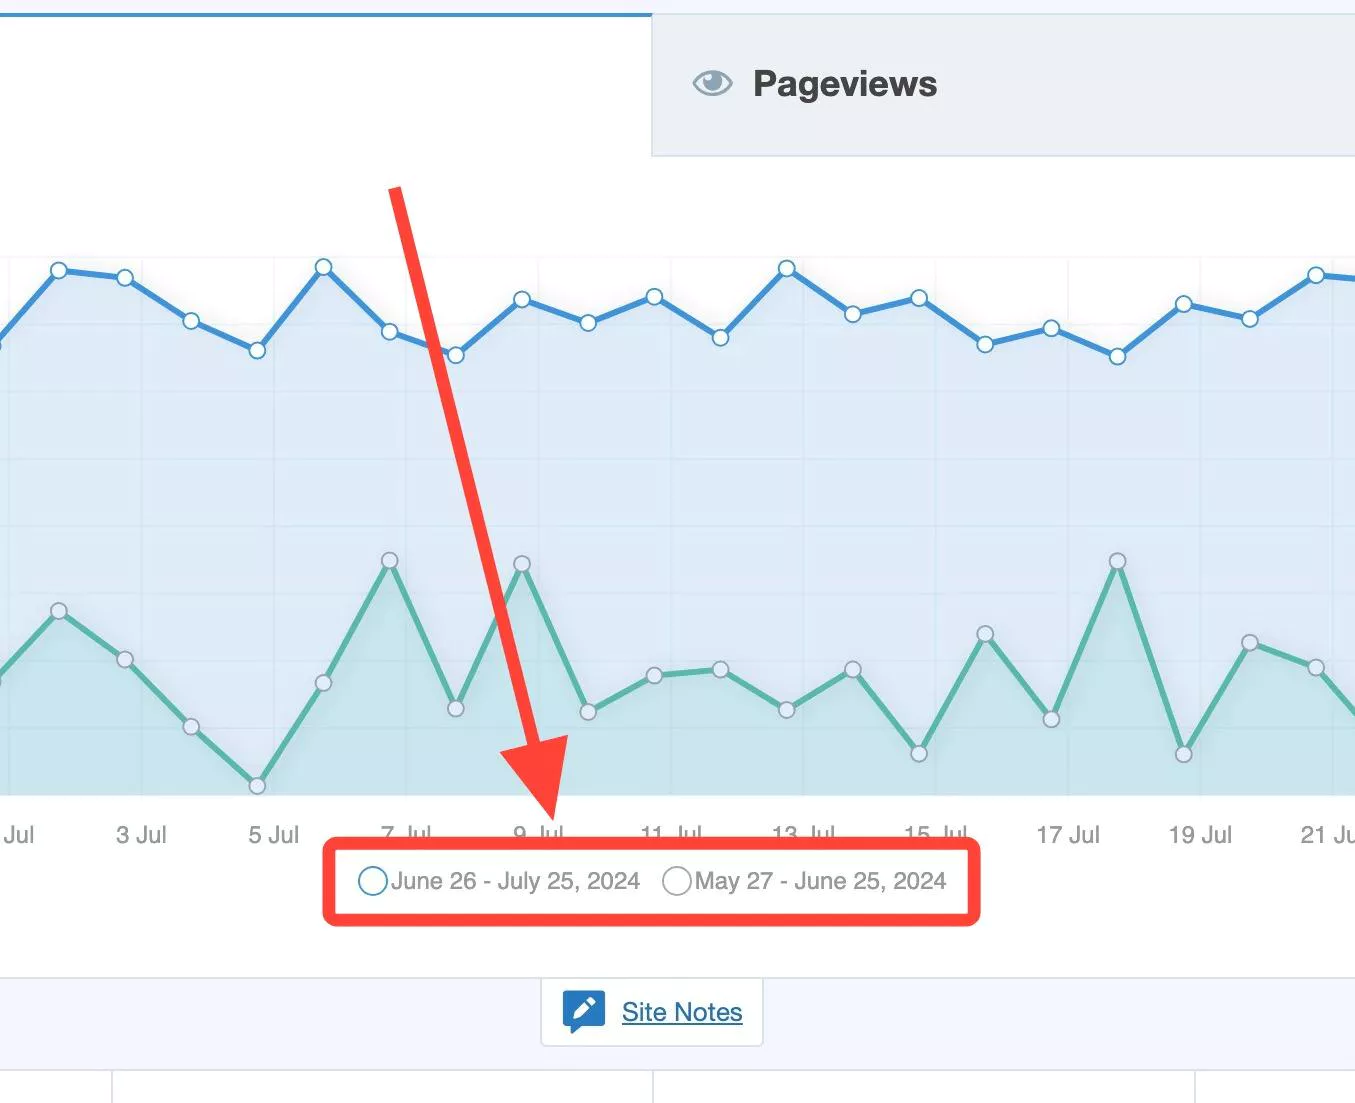
You can hide or show current or previous data points at anytime by clicking on the legends at the bottom of the graph.
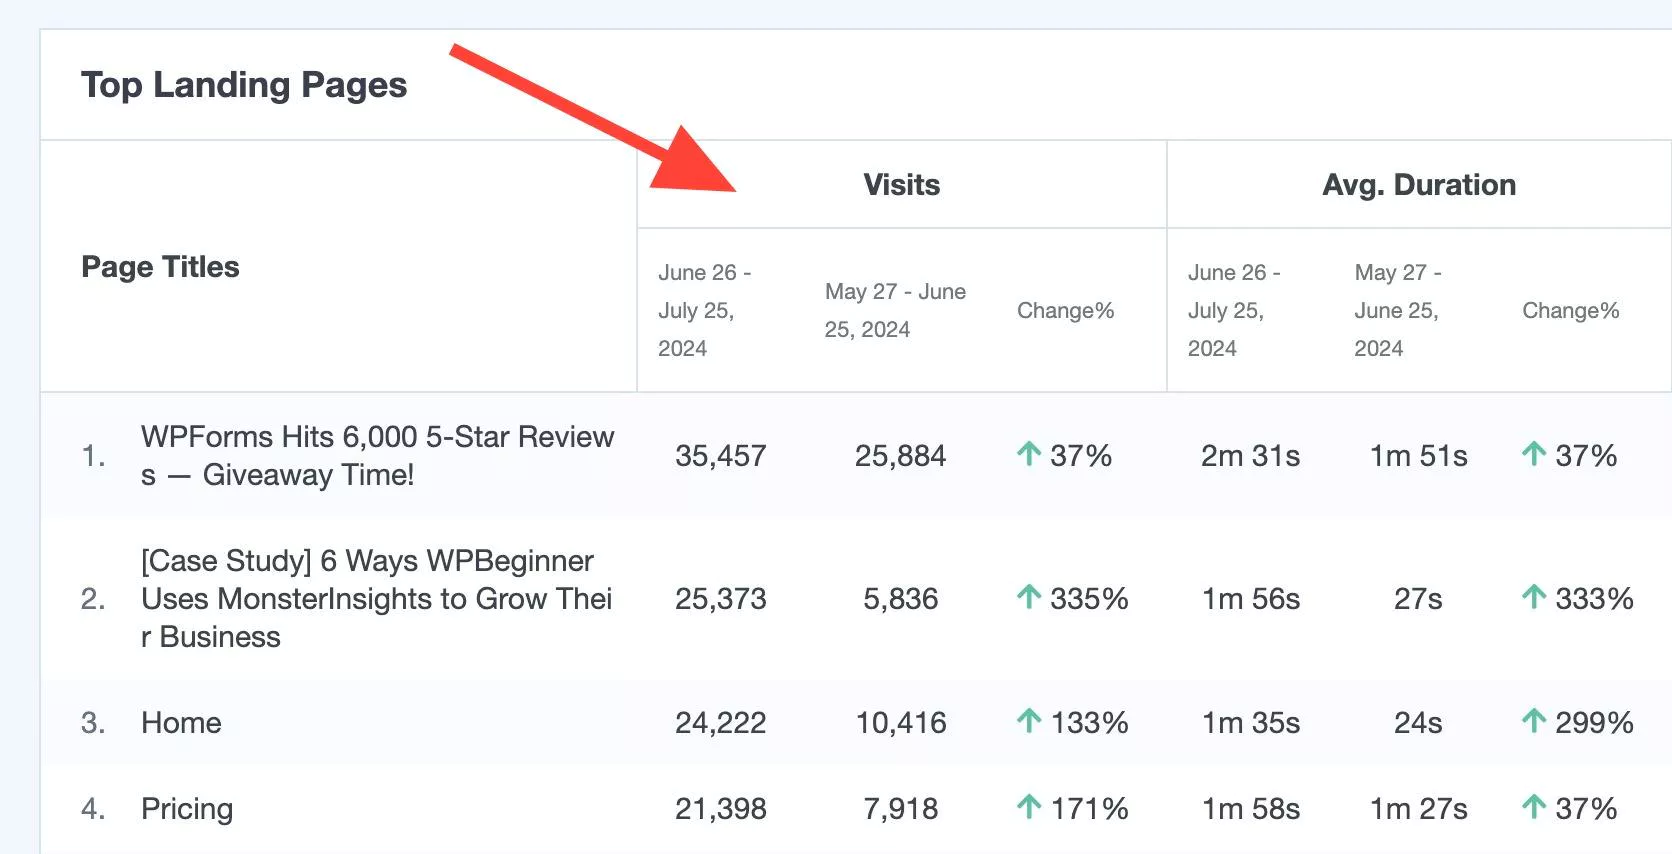
When viewing other reports, you’ll be able to see segmented data per metric.
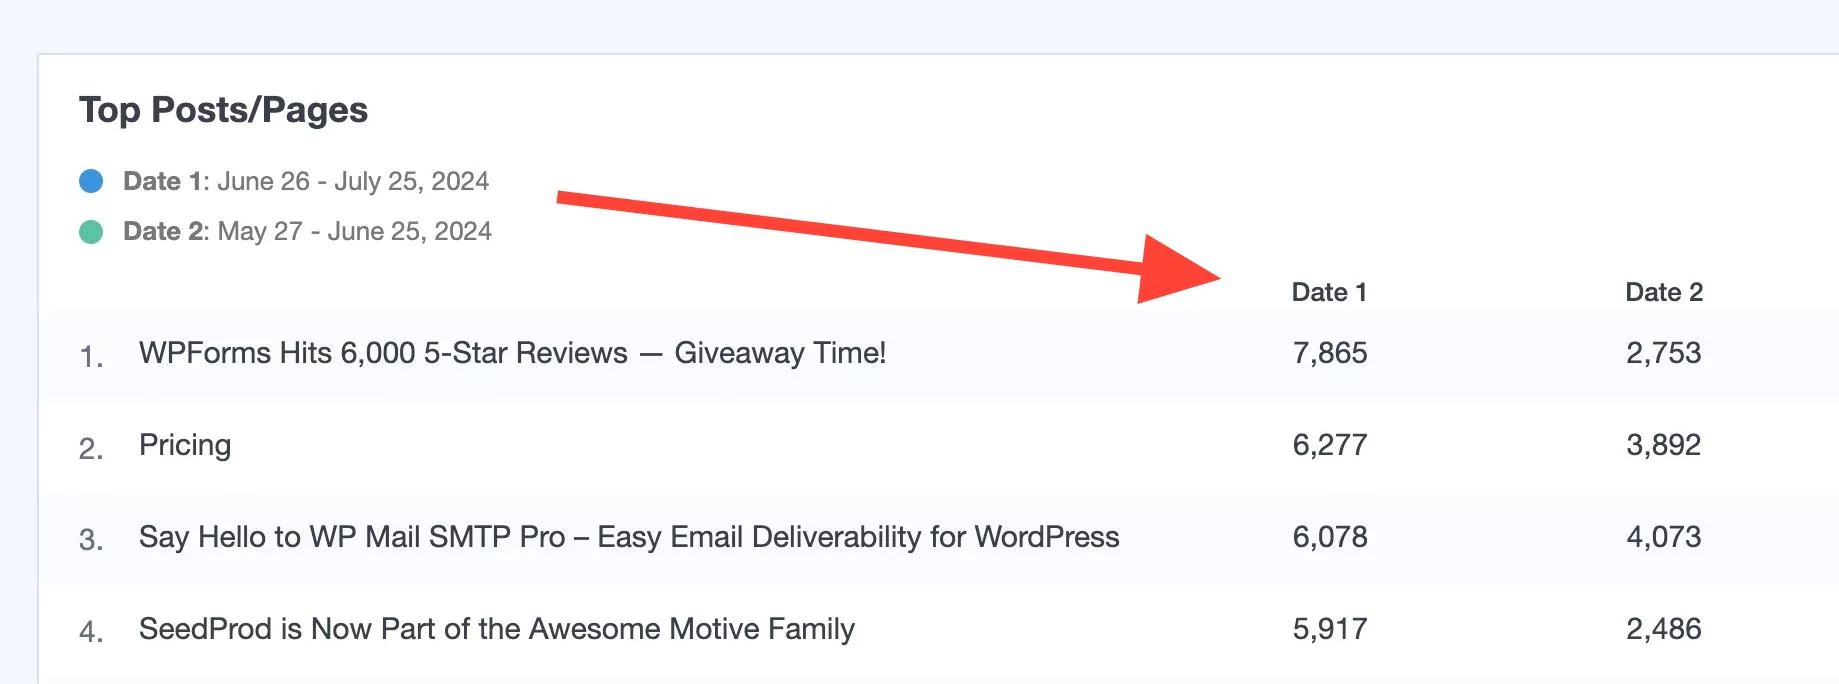
Or see each dataset labelled per the time period, as indicated by the Date 1 and Date 2 labels.
When comparing data to previous periods check for changes in your user acquisition channels, user behavior and total conversions.
This is done by:
- Using the Traffic reports. See where your site visitors are coming from whether it’s from organic or paid search, social media, referrals, direct traffic, or from any campaigns being run.
- Reviewing the Publishers report, which includes things like Top Landing Pages as well as Demographics. If configured, the Dimensions report will show behavior per user role, post tag or category, author and etc. See how site visitors are interacting with your site and what content they’re interested in engaging with.
- Checking out the outbound, affiliate and download clicks in the Publisher reports, or other reports such as eCommerce, Forms, Dimensions and Media (video views), to see the actions being taken by your site visitors, depending on what your end goals are for your WordPress site.
Note
For the most effective analysis, use consistent date ranges and keep in mind seasonal factors that might impact your data (such as holiday sales).
By comparing dates in your MonsterInsights reports, you’ll be able to effectively:
Measure impact by comparing user engagement metrics such as bounce rate, session duration and etc, before and after a website update or after launching a specific campaign to assess its effectiveness.
Identify trends by comparing total transaction and revenue during different times of the year to pinpoint peak sales periods or to identify seasonal fluctuations.
That’s it! You’ve learned how to start using the MonsterInsights date comparisons feature.
What’s next? To better keep track of changes or implementations on your website, learn more about Site Notes.
