Have you ever experienced a situation where you’re driving a lot of traffic to your website but not getting enough conversions?
Often marketers focus so much on attracting visitors that they forget an important step: converting web traffic into leads and potential customers.
In this article, we’ll explain what conversion rate optimization is, why it’s important for your site, and how you can boost it using simple techniques.
What is Conversion Rate Optimization (CRO)?
Conversion rate optimization is a process of getting your visitors to perform a specific action on your website.
What do we mean by action?
Well, if you have an eCommerce store, then the desired action would be for people to buy a product. And if you’re a blogger, then getting visitors to sign up for your newsletter or fill out a form can be an end goal.
And the percentage of visitors that visit your website and complete this action can be calculated through conversion rate. Simply put, the conversion rate is when you divide your number of conversions by the number of people who view your page.
For example, let’s say you got 125 visitors on your product page. And 10 of those visitors bought your product. So, your page’s conversion rate would be 8% (10 divided by 125 and then multiplied by 100).
With that, what conversion rate should you target on your site?
What’s a Good Conversion Rate for Your Website?
Conversion rates vary across different industries. So, when you’re trying to set a goal or a target for your website’s conversion rate, it’s better to look at the industry benchmarks.
For instance, if you’re in the financial industry and your landing pages are in the top 10, then your conversion rate would be on average 24.48%. Similarly, for the eCommerce industry, the top 10 pages have an average conversion rate of 6.25%.
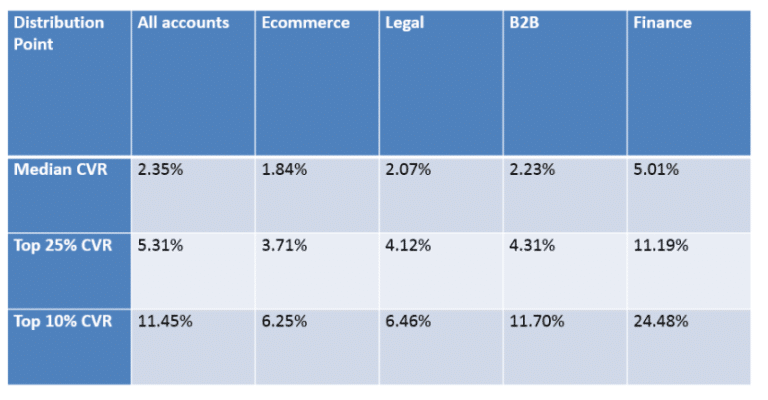
On a side note, you can see that the conversion rate drops if your pages aren’t in the top 10 rankings. So, when you’re working on conversion rate optimization, you should target the top 10% as your benchmark.
So, how can you get more visitors to convert on your WordPress website?
How Do You Optimize Conversion Rate (11 Simple Ways)
Now that you know the basics of conversion rate optimization, let’s look at some techniques that can help you get started.
1. A/B Test Your Landing Page Elements
Are you not sure which headline to use on your landing page? Or perhaps you don’t know which design will convert more?
You can remove any doubt by running an A/B test.
Split tests allow you to experiment with your landing page. You can try different variants of a headline, call to action (CTA), and overall page design to see which converts the best. Once you have the data from the experiment, you can easily pick elements that work.
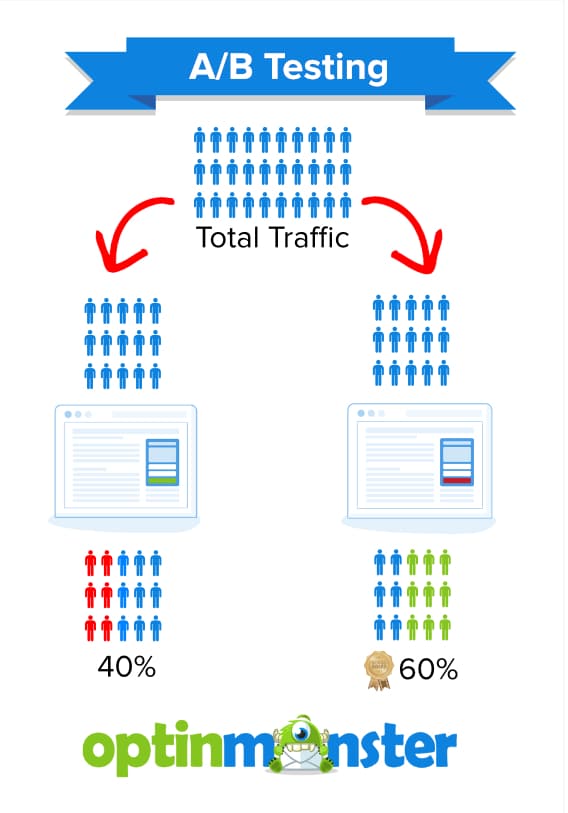
A/B testing software can be a bit expensive, but Thrive Optimize is an excellent choice. Thrive offers many great features, and you can run split tests without any coding.
A free alternative is manually changing elements on your landing pages and monitoring them in your Google Analytics. You should give your changes some time and watch whether or not they improve your page’s conversion rate.
2. Add Exit Intent Popups
Next, you can look at which pages have a low engagement rate and place an exit-intent popup to convert them. This lets you target pages you know are not performing well and see if you can boost conversions.
With an exit intent popup, you can offer exclusive discounts or deals to grab the user’s attention and get them to convert. For example, you can show them on your checkout pages on your eCommerce store to reduce abandoned carts.
To start, you can use MonsterInsights. It’s the best WordPress plugin for Google Analytics. It brings all your important reports inside your WordPress dashboard and helps set up advanced tracking in just a few clicks.
In MonsterInsights, go to the Publishers report, where you’ll see the Top Landing Pages report.
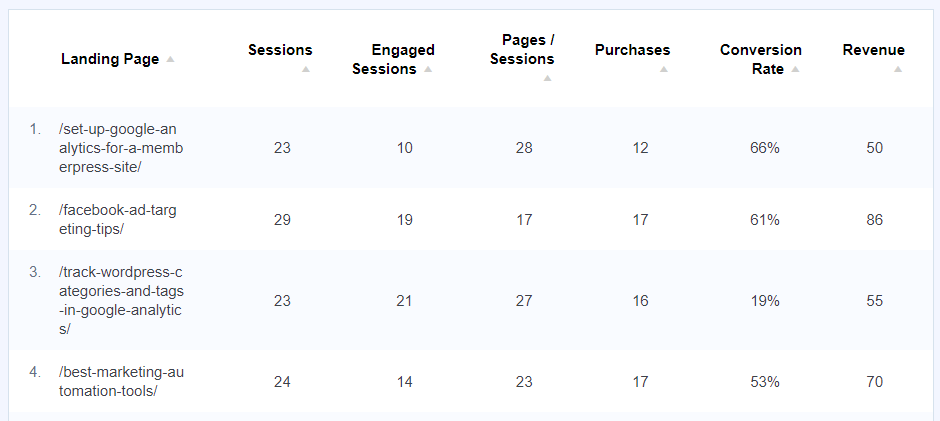
Now, pick pages where the conversion rate is low and where you want to boost conversions. Next, add an exit-intent popup with the best tool to create a popup: OptinMonster.
OptinMonster automatically tracks and detects your user’s movement and will show the popup as they’re about to leave.
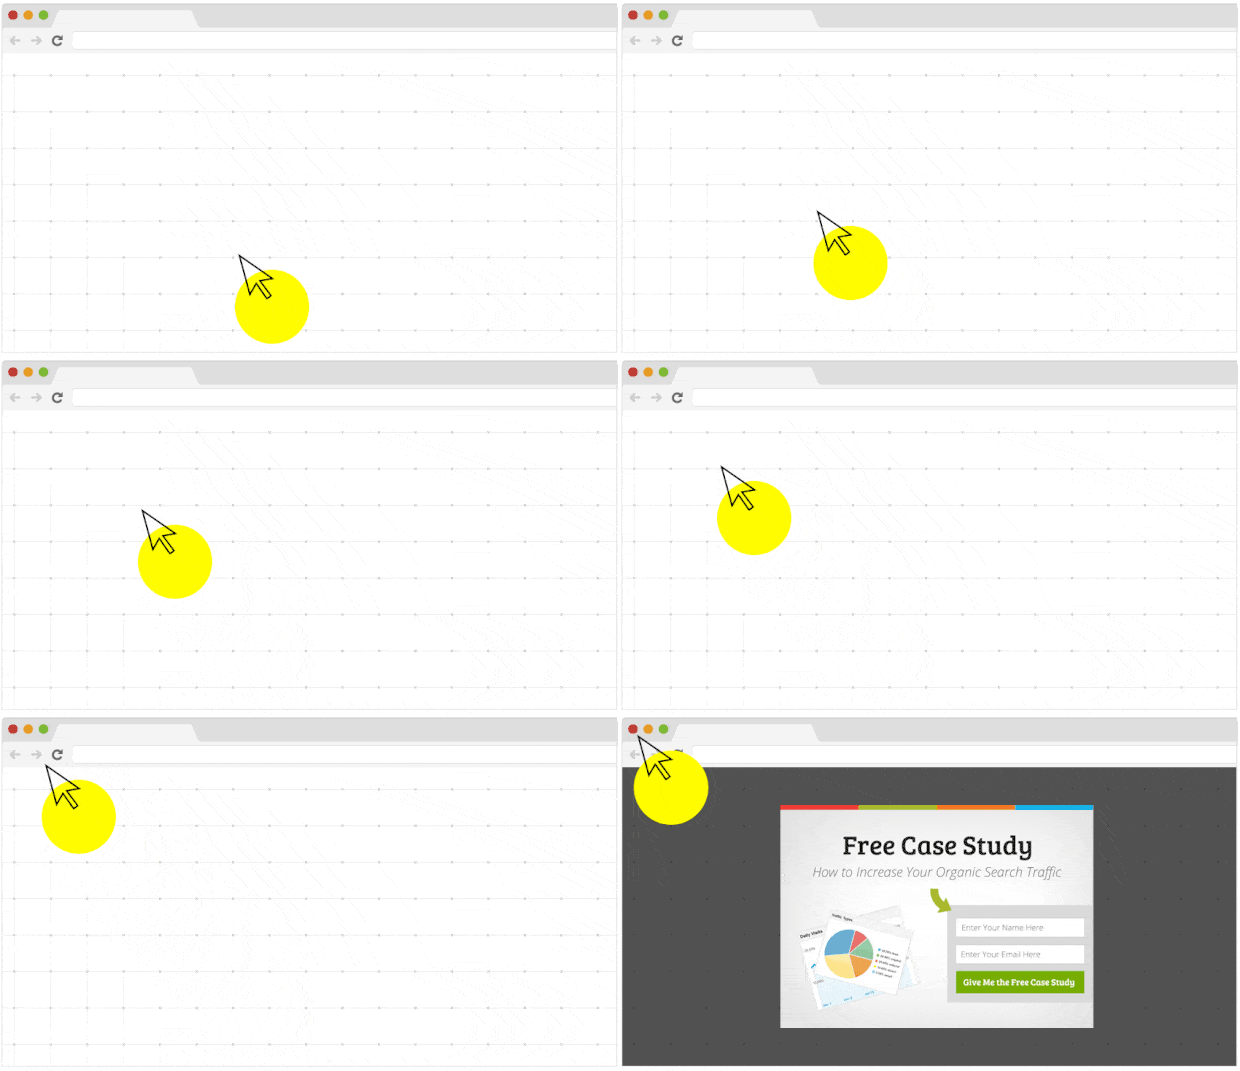
Check out these 40 exit popup hacks to grow subscribers and revenue.
3. Improve CTA Placement with Scroll Depth Tracking
One of the most important parts of conversion rate optimization is to get the placement of your CTAs right. If your CTA isn’t visible or is too far low on the page, then it won’t get any clicks.
To make sure that your call to action is in the right place, you can use scroll depth tracking to gather data. Scroll depth tracking shows how far your users read your blog post before they exit.
If you’re using MonsterInsights, then you can automatically enable scroll depth tracking in WordPress without having to do any manual setup.
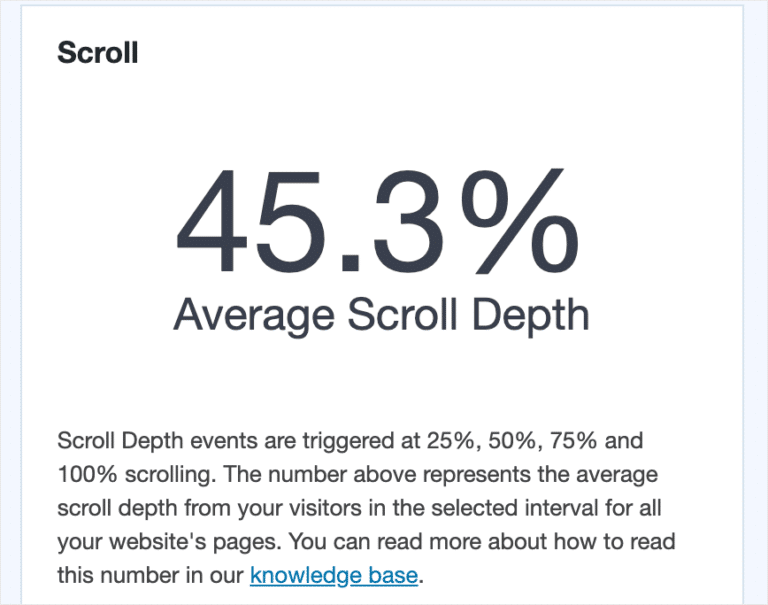
So, as you can see, the average scroll depth of your website is about 45%. This shows that you should place your CTAs above 45% of the page to get maximum chances of conversions.
Additionally, CTAs in blog posts are standard practice but often don’t engage readers as intended. This is due to ‘banner blindness,’ where visitors habitually overlook banner-style elements.
Moreover, many readers don’t fully read posts but skim through them.
To counter this, text-based CTAs are effective. They blend within the content, sometimes capturing the reader’s attention better.
Testing out anchor text CTAs can be a smart move to boost your website’s conversion rates.
4. Target Transactional Keywords on Your Website
Now, you might be wondering what connection conversion rate optimization has with your site’s SEO. Well, there’s no direct relationship, but it can indirectly help boost your sales.
By looking at the Google search console report, you can find out which keywords your site is ranking on. If you see that some pages are getting tons of traffic but no conversions, then you can optimize them to convert visitors into customers.
Not only that, but you can also look for transaction keywords and their rankings. Transactional keywords are when users are ready to purchase. For example, ‘best lightweight laptop’ would be a transactional keyword.
If you can rank in the top 10 for such search terms, you’ll have a higher chance of boosting your conversions. And using MonsterInsights, you can configure your WordPress website with Google Search Console.
Then, using its Search Console report, you can find the top 50 search terms your site is ranking on Google.
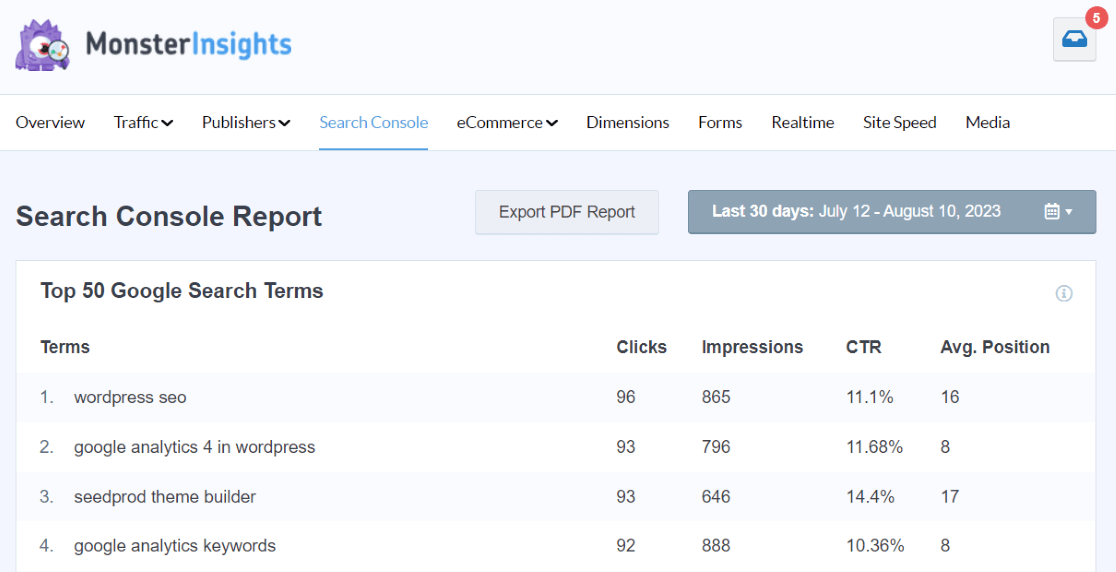
The data from the report can help you see if your site is mostly ranking for informational keywords. If that’s the case, then you can perform keyword research and find more transactional keywords to target on your site.
5. Create Marketing Campaigns Based on User’s Location
Ever wonder which country your visitors come from on your site? Identifying the location of your web traffic can help you create personalized marketing campaigns and boost conversions. In fact, 18% of local searches on mobile result in a sale within a day.
So, with geomarketing, you can deliver marketing messages to the right people at the right time. And the first step is to find your audience’s location. With MonsterInsights, you can view the data in your WordPress dashboard.
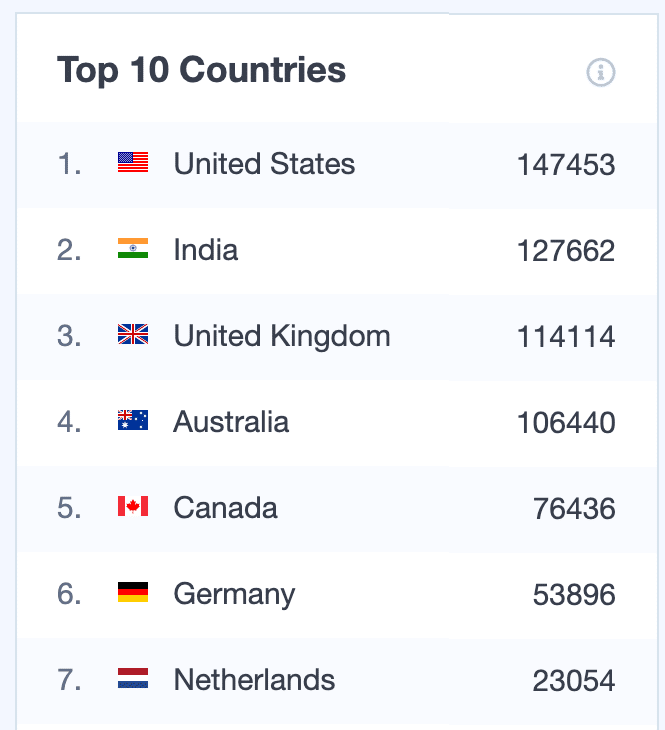
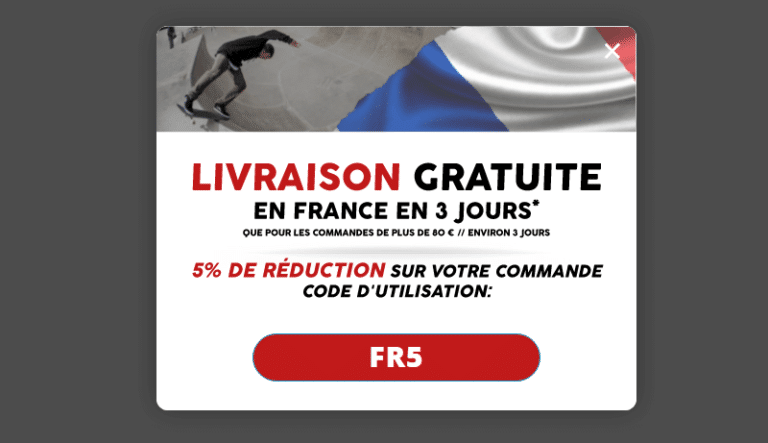
Next, you can show popup messages and exclusive discounts to people from a particular location. This is where OptinMonster can help you out. Using its Geo-Location Targeting feature, you can show popups based on country, city, or ZIP code.
You can read our guide on how to use geomarketing to enhance your conversions for more tips and tricks.
6. Replicate High Converting Forms on Your Site
Having forms on your website is a great way of keeping in touch with your visitors. Plus, they help you collect emails. And if you have order forms, then you can see how many people bought your products.
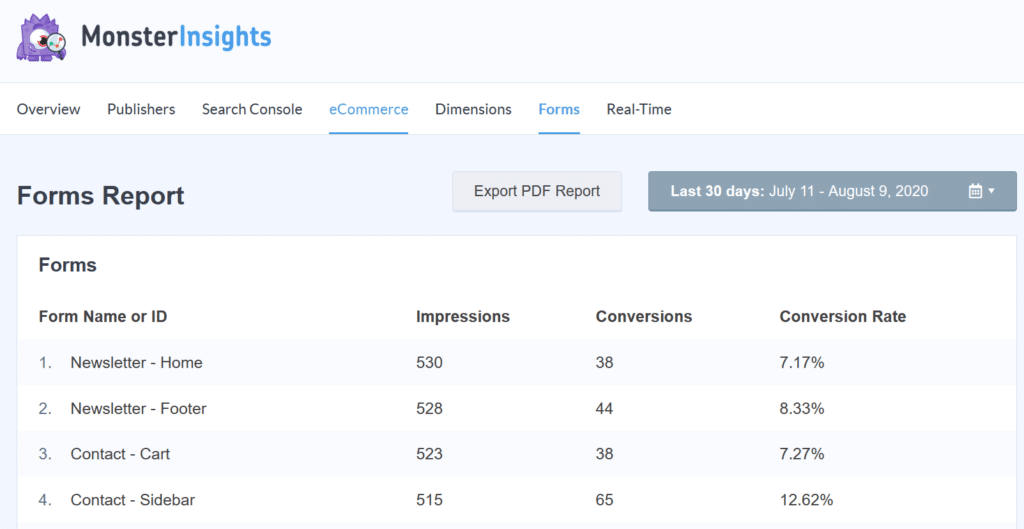
To improve your conversion rate, you can find out which forms are performing, so you can replicate them for other products and pages.
This is where the MonsterInsights Forms addon can help you out. It automatically tracks form conversion in WordPress and shows you a detailed report.
7. Invest in Top Conversion Sources on Your Online Store
Now, if you have an eCommerce store, then you can find out which sources send you traffic that converts. After you’ve narrowed down these sources, you can find more websites like them to promote your products and boost conversions.
This way, you’ll save time and effort by focusing on attracting visitors who have a high chance of buying your products. And with MonsterInsights eCommerce reports, you view your top conversion sources.
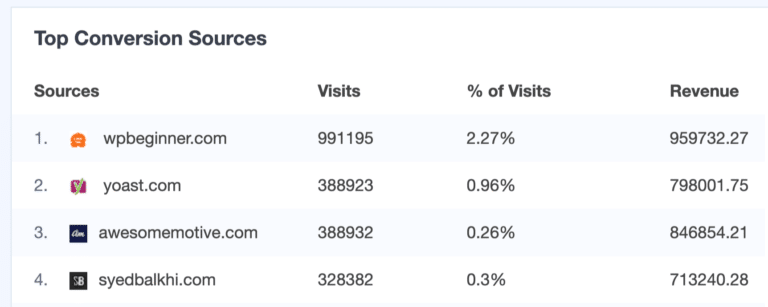
Next, you can partner with these websites and perhaps do a guest post or look for advertising opportunities. Not only that, but you can offer exclusive discounts to visitors from these sites, so you have a higher chance of getting a conversion.
8. Communicate With Visitors on High-Converting Pages
Try using live chat on your website to connect with visitors. This helps you give support and answers when they need it.
Put chat features on popular pages like where you list prices or products. This way, visitors can get quick answers while they’re considering taking a specific action.
You can even set up your chat to start a conversation if someone’s been on a page for a while, like offering help if they’ve been there for more than a minute.
9. Promote Your Top Affiliate on Homepage
Now, if you’re into affiliate marketing, then you can find out which affiliates get the most clicks and promote them on your homepage to increase conversions.
With MonsterInsights, you can easily set up affiliate link tracking in WordPress.
To view which affiliates get a lot of clicks, you can view the MonsterInsights Publishers report. It will show your affiliate links along with the total clicks they got.
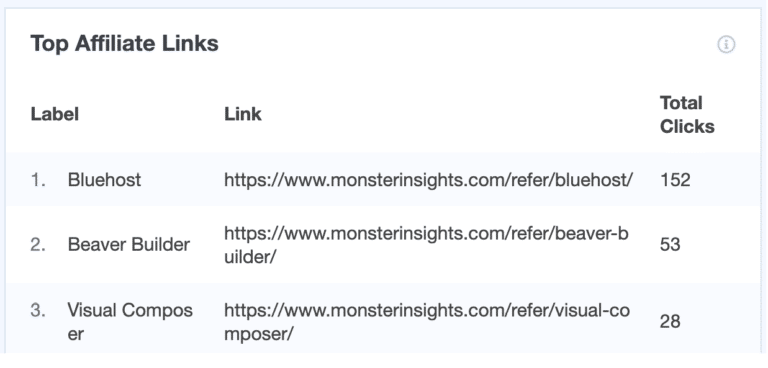
Now, pick the best affiliate links and then promote them on your homepage. You can create a floating bar optin to show them and offer discounts to attract users.
And if you want to instantly grab your visitor’s attention, then you can use a countdown timer. It will create urgency and help improve your conversion rate.

10. Use Social Proof and Add Sales Notification Popups
Social proof is a great way of building trust and increasing conversions on your website. It reassures a customer that others are also buying your products and services.
And to leverage social proof and boost conversions, you can use TrustPulse. It’s a free WordPress plugin, and you can easily add recent sales notification popup on your website.

To learn more tricks for your online store, go through our post on 24 eCommerce hacks to double your conversions.
11. Make Your Checkout Process Simple
Often, new business owners make a mistake by making their website’s checkout process complex. They have too many steps that can put off customers, and they end up leaving your website without making a purchase.
So, an important part of conversion rate optimization is that people can easily checkout when signing up for your service.
Here are a few ways you can make your checkout process easier:
- Remove unnecessary steps in the checkout process
- Offer guest login option at checkout
- Allow customers to use their social accounts for quick login
- Make sure you have multiple payment options
- A/B test your checkout forms to see which design converts the best
- Ask for only important information at checkout
- Offer one-step checkout
- Ensure that checkout pages load quickly
New: Conversations AI For Boosting Conversion Rate Optimization (CRO)
Now that you know all about Conversion Rate Optimization (CRO) and how to implement it, wouldn’t it be great if there was an easier way to track your performance?
Well, for MonsterInsights users, meet Conversations AI.
Conversations AI is integrated right into your WordPress dashboard and allows you to get instant insights on your CRO efforts with a simple question. No more manually going through different reports to track performance.
Want to know which landing page has the best conversion rate? Just ask. Curious about which campaign brought in the most conversions? Conversations AI has the answer.
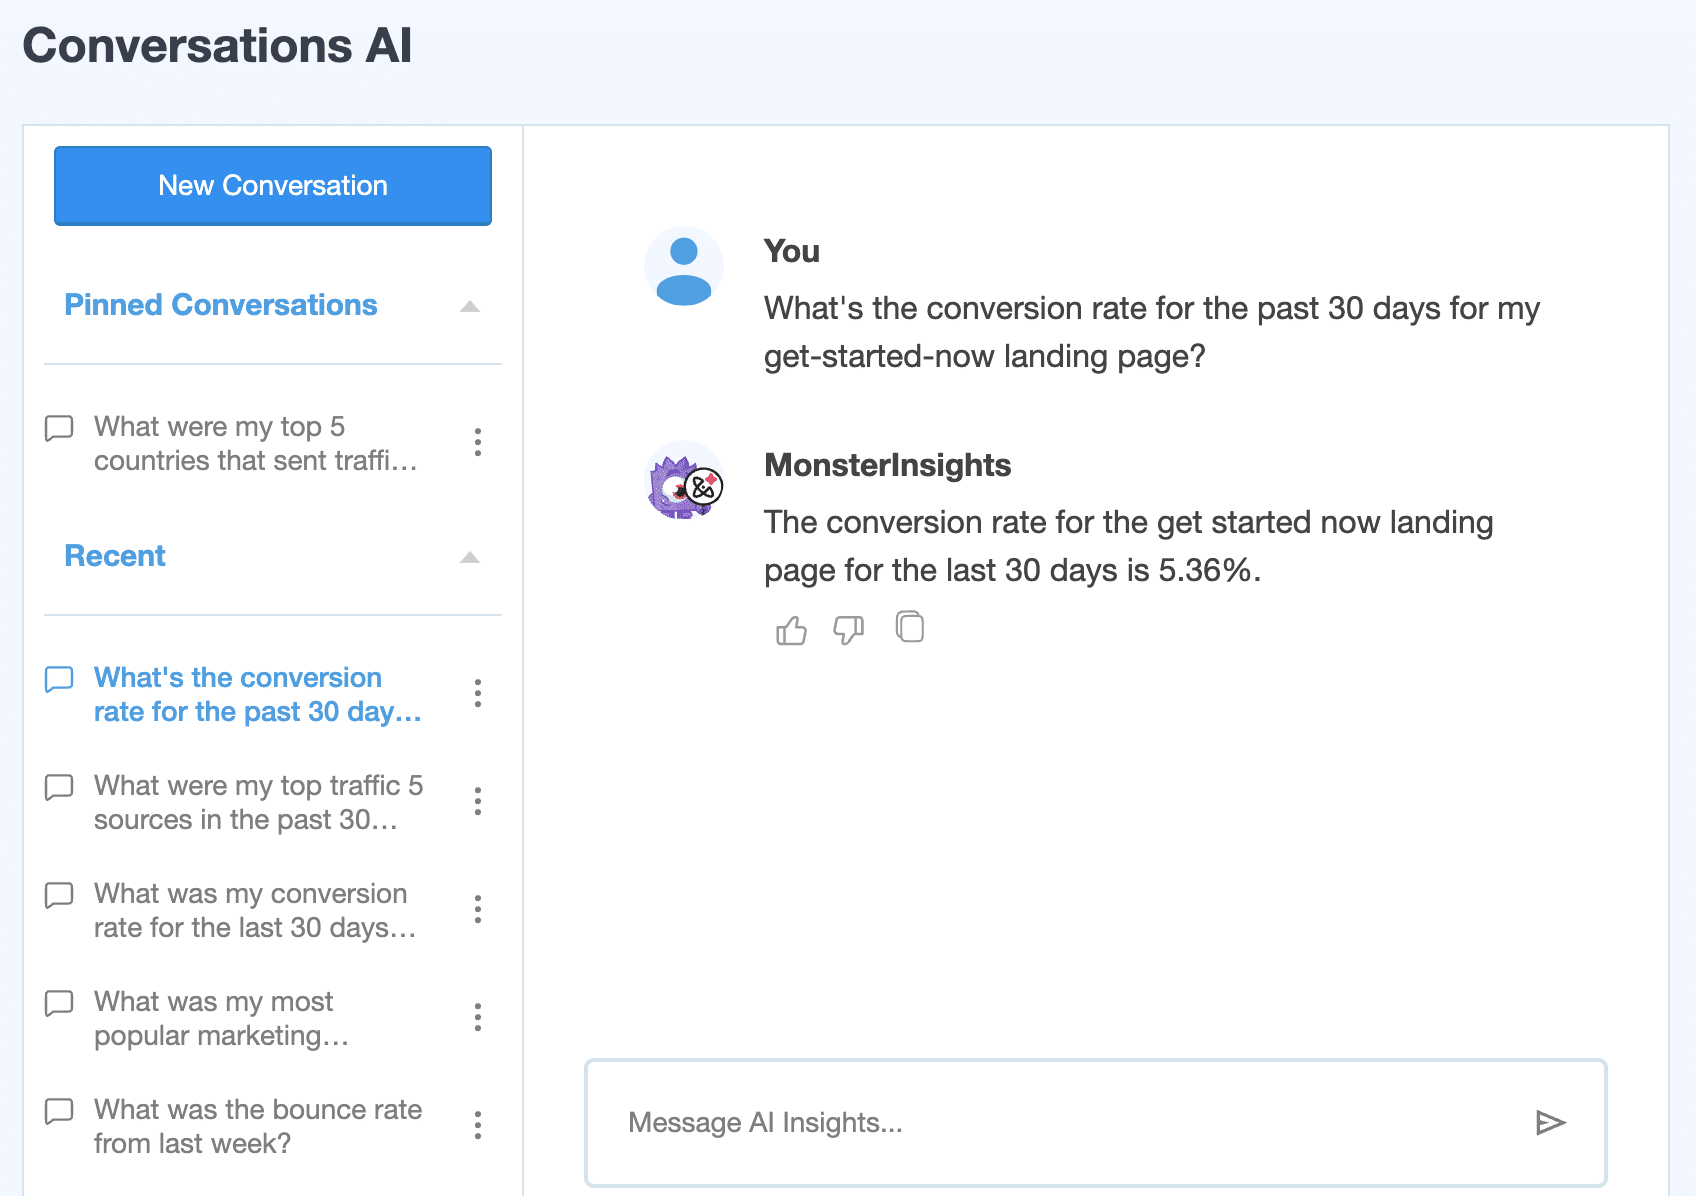
It makes accessing your key metrics faster and more efficient than ever!
Get started with MonsterInsights Pro and use Conversations AI to track and improve your conversion rate today.
With that, you’ve made it to the end of the guide. Give these tips and tricks a try to improve your site’s conversion rate.
We hope you liked our article on beginner’s guide to conversion rate optimization (CRO). You can also check out our post on how to properly set up Google Analytics in WordPress.
And don’t forget to follow us on Facebook, X and YouTube for useful guides about WordPress and tutorials about Google Analytics.
