If you’re active on social media platforms, you’re probably wondering if the work you put in is actually paying off. To find out, you’ll need to find the best social media metrics to track and keep an eye on them.
However, when every social media site provides different analytics, it’s hard to figure out what the best metrics really are. Should you focus on impressions? Clicks? Interactions? What else?
In this article, we’ll help you determine the best social media metrics to track to understand if your social media efforts are helping you win online.
How Do You Track Social Media Metrics?
Before we get into our list of the best metrics, there’s an important question to answer first: how do you track your social media metrics?
The answer to this question really depends on which social media networks you’re posting on. For example, if you’re focusing on Instagram and TikTok, you might get away with accessing your analytics through each platform, plus via Google Analytics.
If you’re posting on more networks, it might make sense to find a social media reporting tool (like Hootsuite or Buffer) to combine your analytics into one dashboard so that you can see what’s going on across all of them in one spot.
No matter what tools you might use for social media analytics, if you have a website, you’ll need to also use Google Analytics to see what your visitors from social media are doing on your site.
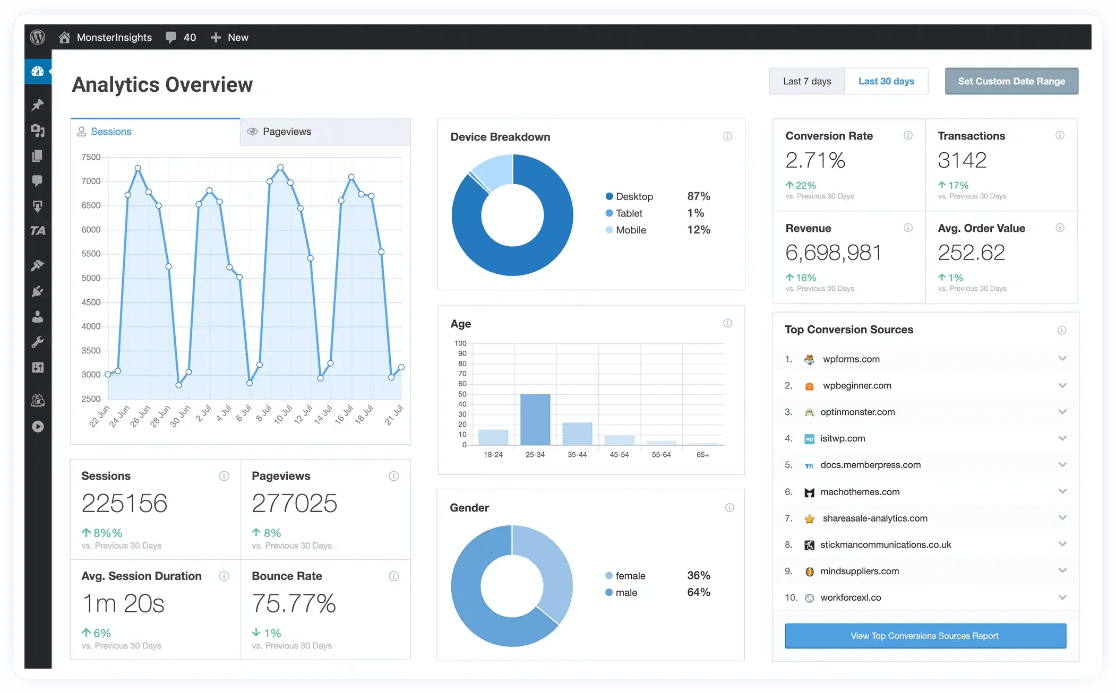
Google Analytics can make finding your social media traffic complicated. If you have a WordPress website, though, a simple solution is MonsterInsights.
MonsterInsights is the best Google Analytics plugin for WordPress. It allows you to easily connect your WordPress site with Google Analytics to view all the data that matters most, including social media traffic data, right inside your WordPress dashboard.

Plus, with just a few clicks, you can set up advanced tracking features that don’t come out of the box with Google Analytics. That includes eCommerce tracking, accurate form submission tracking, media tracking, author tracking, link click tracking, and so much more.
Grab MonsterInsights at the Plus level or above to access our Social Media report:

Start Tracking Social Media Now
Our Favorite Social Media Metrics to Track
Ready to keep track of the social media stats that matter the most to your business or brand? Let’s dive into our list of the most important social media metrics.
#1: Reach
How many people are seeing your content? Reach is simply the number of people your content is reaching. It could be your posts, stories, reels, pages, or any part of your social media presence. It’s a measure of how many individual people are coming across your content.
Increasing your reach can lead to better brand awareness, plus more clicks, engagement, and interactions.
To increase your reach, try:
- Creating attention-grabbing content
- Creating shareable content
- Posting content that doesn’t quickly get outdated
- Crafting great captions that use the right hashtags and keywords
- Cross-promoting your social media channels
- Publishing your social media feed(s) on your website with a tool like Smash Balloon
#2: Impressions
Impressions are the number of times your content is seen. It’s similar to reach but not the same — some people may have seen your content more than once, resulting in 2 impressions. For that reason, impressions will most likely be higher than your reach.
Impressions data can really help you optimize your channels. Look at your impressions for each individual post or story. Which ones had more impressions? Of the ones that had more, what made them stand out? Experiment with content types and posting times to find what gets the most impressions and when.
To increase impressions, try all of the same things we listed above to increase your reach.
#3: Engagement
Engagement means different things on different platforms, but in a nutshell, it means interactions with your content. Whether that’s through likes, comments, shares, clicks, or any other type of interaction, your total engagement will include each of them.
To calculate your total engagement, the number of engagements (clicks, likes, comments, etc.) is divided by your total number of followers and multiplied by 100. You can calculate your engagement rate for individual posts, stories, and more.
Your overall engagement rate is calculated by dividing the total number of engagements by your total number of followers.
To increase your engagement, try:
- Posting interactive content like polls and surveys
- Encouraging your followers to share your content
- Using relevant hashtags or keywords to help interested users find your content
- Keeping your feed varied and interesting
#4: Click-Through Rate
Alright, now you know how many people are seeing and engaging with your content. But how many people are clicking on those posts or ads?
Click-through rate is especially important for anyone running ads or posting links to a website. If your end goal is to have someone click on your ad or post, then you can calculate the click-through rate by dividing your total number of clicks by your total number of impressions, and then multiplying by 100.
To increase your click-through rate, try:
- Linking to exciting, compelling content
- Creating offers your followers will be interested in
- Using power words in your text
- Studying your audience to learn more about their interests and preferences
#5: Conversion Rate
What’s the ultimate goal of your posts or ads? Maybe it’s following you on the social platform you’re posting on, registering for an event, joining a group, purchasing a product, downloading a resource, or any other type of ultimate goal.
If the conversion is on your social media platform, you’ll need to calculate your conversions based on your numbers there. To find your conversion rate, divide the number of conversions by total clicks, then multiply by 100.
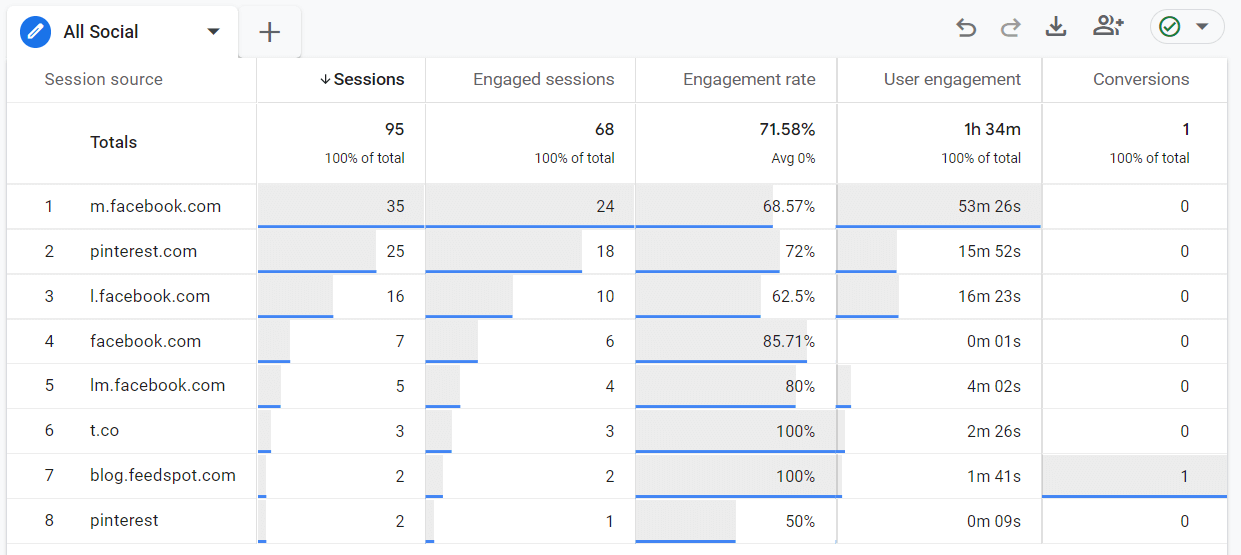
If your conversion is on your website, you can use Google Analytics to find your conversion rate. To build the custom explore report you see below, check out How to Set up Google Analytics Social Media Tracking.

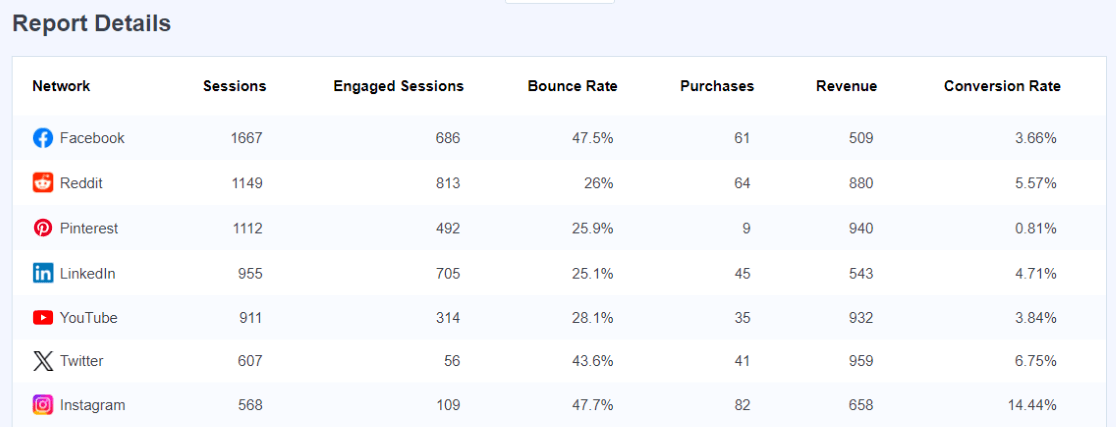
WordPress users, you can access a ready-made Social Media report inside the MonsterInsights plugin. Make sure you’ve got a Plus license or above, then head to Insights » Reports » Traffic » Social Media:

Running Facebook ads? Make sure to check out our tutorial on How to Track Meta (Facebook) Ads in Google Analytics Easily.
To increase your conversion rate, try:
- Creating conversion-focused landing pages
- Making sure you’re targeting the right audience
- Using exit-intent popups
- Using more conversion rate optimization tactics on your website
#6: Audience Growth
If you’re relying on organic social traffic (not on social ads), then audience growth is definitely a key metric to keep an eye on. You want to constantly and consistently grow your follower base so that more and more people are eligible to see your content.
Audience growth is a metric that you’ll watch inside your social media platform analytics dashboard or within your social media analytics tool if you’re using one.
To grow your audience on social media, try:
- Adding your social media feeds to your website
- Running a social media ads campaign to promote your page or profile
- Sharing more engaging content that your users want to share
- Sharing content often
- Commenting as your page or profile on other popular posts or pages
#7: Virality Rate
Virality rate measures how quickly your content reaches a larger audience. As people share your content, the number of impressions it gets will grow exponentially. Virality rate measures those impressions to tell you, in a nutshell, how quickly your content is going viral.
To calculate your virality rate, take the number of shares a post has and divide it by the number of impressions it has. Then, multiply by 100 to get a percentage. The higher your virality rate, the better it’s doing.
To increase your virality rate, try:
- Making connections with other pages or groups with a lot of followers that’ll share your content
- Creating super shareable content
#8: Cost per click
If you’re running ads on any social media platform, cost per click is an incredibly important metric to keep track of. It measures how much each click on your ad costs you.
Not only is cost per click important to keep an eye on for budget reasons, but it’s also one of the most important metrics you can use to decide if running the ad is actually worth it.
For example, if your ad costs $1 per click but you calculate your benefit (based on conversion data) to be about $.75 per click, then something about that ad isn’t working well enough.
To lower your cost per click, try:
- Refining your audience targeting
- Making sure you don’t have any overlap if targeting multiple audiences
- Optimizing your landing page
- Making sure your ad is worded clearly
Social Media Metrics FAQ
What are the most important metrics for social media?
The most important metrics for social media are:
- Reach
- Impressions
- Engagement
- Click-through Rate
- Conversion Rate
- Audience Growth
- Virality Rate
- Cost-per-click
How do you track social media metrics?
To track social media metrics, use a combination of the analytics from each social media channel (or from a social media analytics platform) and Google Analytics.
How do you monitor social media engagement?
Social media engagement is your total number of engagements (such as likes, comments, shares, or clicks) divided by the total number of impressions. Multiply this number by 100 to get your engagement rate percentage.
That’s it! We hope you have a better idea now about which social media metrics to track for your social channels.
If you liked this article, you might also want to check out:
Beginners Guide to Conversion Rate Optimization (CRO)
How to Set up Google Analytics Social Media Tracking
9 Best Social Media Plugins for WordPress
How to Do a Giveaway on TikTok in WordPress (Easily)
Not using MonsterInsights yet to track your social media traffic? What are you waiting for?
And don’t forget to follow us on Twitter, Facebook and YouTube for more helpful Google Analytics tips.
